TrendTwisterV1.5 (Forex Ready + Indicators)A Precision Trend-Following TradingView Strategy for Forex**
HullShiftFX is a Pine Script strategy for TradingView that combines the power of the **Hull Moving Average (HMA)** and a **shifted Exponential Moving Average (EMA)** with multi-layered momentum filters including **RSI** and **dual Stochastic Oscillators**.
It’s designed for traders looking to catch high-probability breakouts with tight risk management and visual clarity.
Chart settings:
1. Select "Auto - Fits data to screen"
2. Please Select "Scale Price Chart Only" (To make the chart not squished)
### ✅ Entry Conditions
**Long Position:**
- Price closes above the 12-period Hull Moving Average.
- Price closes above the 5-period EMA shifted forward by 2 bars.
- RSI is above 50.
- Stochastic Oscillator (12,3,3) %K is above 50.
- Stochastic Oscillator (5,3,3) %K is above 50.
- Hull MA crosses above the shifted EMA.
**Short Position:**
- Price closes below the 12-period Hull Moving Average.
- Price closes below the 5-period EMA shifted forward by 2 bars.
- RSI is below 50.
- Stochastic Oscillator (12,3,3) %K is below 50.
- Stochastic Oscillator (5,3,3) %K is below 50.
- Hull MA crosses below the shifted EMA.
---
## 📉 Risk Management
- **Stop Loss:** Set at the low (for long) or high (for short) of the previous 2 candles.
- **Take Profit:** Calculated at a risk/reward ratio of **1.65x** the stop loss distance.
---
## 📊 Indicators Used
- **Hull Moving Average (12)**
- **Exponential Moving Average (5) **
- **Relative Strength Index (14)**
- **Stochastic Oscillators:**
- %K (12,3,3)
- %K (5,3,3)
Search in scripts for "Exponential Moving Average"

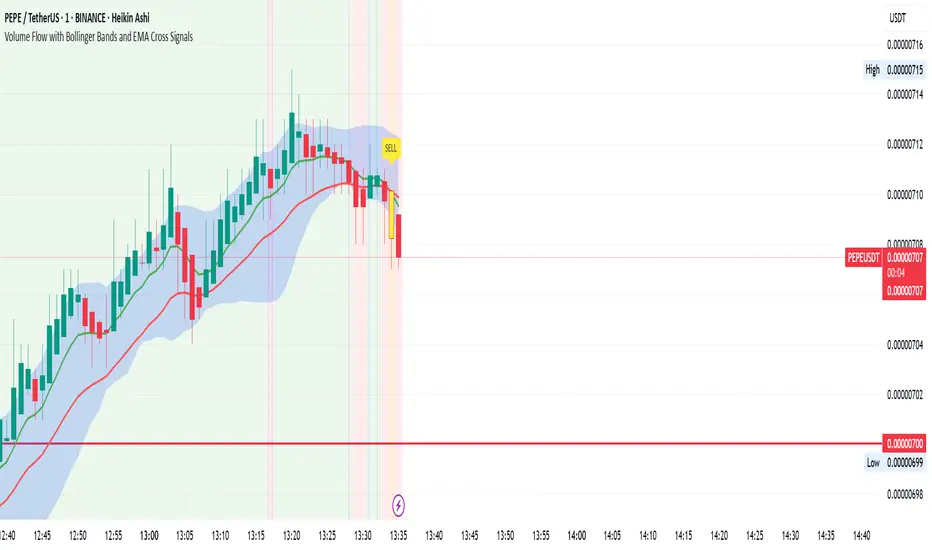
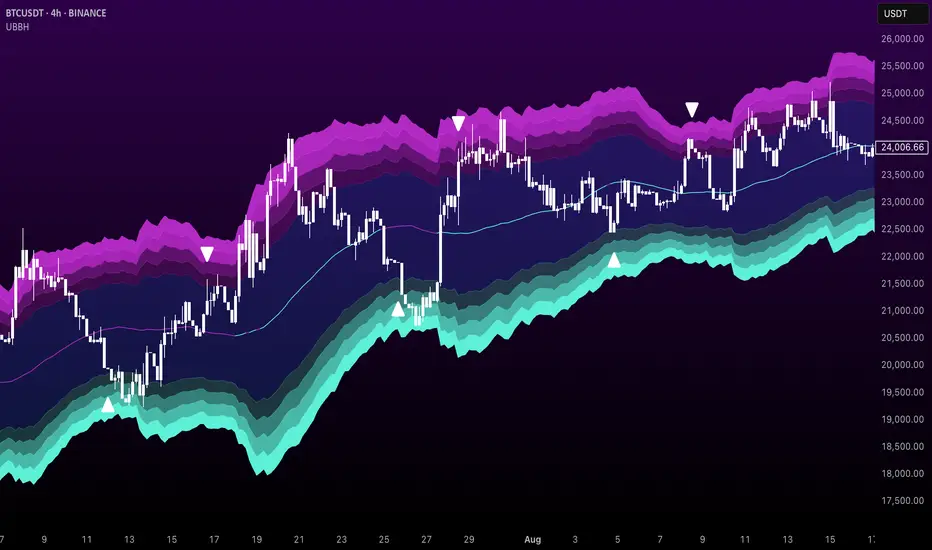
Volume Flow with Bollinger Bands and EMA Cross SignalsThe Volume Flow with Bollinger Bands and EMA Cross Signals indicator is a custom technical analysis tool designed to identify potential buy and sell signals based on several key components:
Volume Flow: This component combines price movement and trading volume to create a signal that indicates the strength or weakness of price movements. When the price is rising with increasing volume, it suggests strong buying activity, whereas falling prices with increasing volume indicate strong selling pressure.
Bollinger Bands: Bollinger Bands consist of three lines:
The Basis (middle line), which is a Simple Moving Average (SMA) of the price over a set period.
The Upper Band, which is the Basis plus a multiple of the standard deviation (typically 2).
The Lower Band, which is the Basis minus a multiple of the standard deviation. Bollinger Bands help identify periods of high volatility and potential overbought/oversold conditions. When the price touches the upper band, it might indicate that the market is overbought, while touching the lower band might indicate oversold conditions.
EMA Crossovers: The script includes two Exponential Moving Averages (EMAs):
Fast EMA: A shorter-term EMA, typically more sensitive to price changes.
Slow EMA: A longer-term EMA, responding slower to price changes. The crossover of the Fast EMA crossing above the Slow EMA (bullish crossover) signals a potential buy opportunity, while the Fast EMA crossing below the Slow EMA (bearish crossover) signals a potential sell opportunity.
Background Color and Candle Color: The indicator highlights the chart's background with specific colors based on the signals:
Green background for buy signals.
Yellow background for sell signals. Additionally, the candles are colored green for buy signals and yellow for sell signals to visually reinforce the trade opportunities.
Buy/Sell Labels: Small labels are placed on the chart:
"BUY" label in green is placed below the bar when a buy signal is generated.
"SELL" label in yellow is placed above the bar when a sell signal is generated.
Working of the Indicator:
Volume Flow Calculation: The Volume Flow is calculated by multiplying the price change (current close minus the previous close) with the volume. This product is then smoothed with a Simple Moving Average (SMA) over a user-defined period (length). The result is then multiplied by a multiplier to adjust its sensitivity.
Price Change = close - close
Volume Flow = Price Change * Volume
Smoothed Volume Flow = SMA(Volume Flow, length)
The Volume Flow Signal is then: Smooth Volume Flow * Multiplier
This calculation represents the buying or selling pressure in the market.
Bollinger Bands: Bollinger Bands are calculated using the Simple Moving Average (SMA) of the closing price (basis) and the Standard Deviation (stdev) of the price over a period defined by the user (bb_length).
Basis (Middle Band) = SMA(close, bb_length)
Upper Band = Basis + (bb_std_dev * Stdev)
Lower Band = Basis - (bb_std_dev * Stdev)
The upper and lower bands are plotted alongside the price to identify the price's volatility. When the price is near the upper band, it could be overbought, and near the lower band, it could be oversold.
EMA Crossovers: The Fast EMA and Slow EMA are calculated using the Exponential Moving Average (EMA) function. The crossovers are detected by checking:
Buy Signal (Bullish Crossover): When the Fast EMA crosses above the Slow EMA.
Sell Signal (Bearish Crossover): When the Fast EMA crosses below the Slow EMA.
The long_condition variable checks if the Fast EMA crosses above the Slow EMA, and the short_condition checks if it crosses below.
Visual Signals:
Background Color: The background is colored green for a buy signal and yellow for a sell signal. This gives an immediate visual cue to the trader.
Bar Color: The candles are colored green for buy signals and yellow for sell signals.
Labels:
A "BUY" label in green appears below the bar when the Fast EMA crosses above the Slow EMA.
A "SELL" label in yellow appears above the bar when the Fast EMA crosses below the Slow EMA.
Summary of Buy/Sell Logic:
Buy Signal:
The Fast EMA crosses above the Slow EMA (bullish crossover).
Volume flow is positive, indicating buying pressure.
Background turns green and candles are colored green.
A "BUY" label appears below the bar.
Sell Signal:
The Fast EMA crosses below the Slow EMA (bearish crossover).
Volume flow is negative, indicating selling pressure.
Background turns yellow and candles are colored yellow.
A "SELL" label appears above the bar.
Usage of the Indicator:
This indicator is designed to help traders identify potential entry (buy) and exit (sell) points based on:
The interaction of Exponential Moving Averages (EMAs).
The strength and direction of Volume Flow.
Price volatility using Bollinger Bands.
By combining these components, the indicator provides a comprehensive view of market conditions, helping traders make informed decisions on when to enter and exit trades.
NasyI## NasyI - Multi-Timeframe Technical Analysis Toolkit
### English Description
**NasyI** is a comprehensive technical analysis indicator designed to provide traders with a complete view of market dynamics across multiple timeframes. This indicator combines the power of Exponential Moving Averages (EMAs), Simple Moving Averages (MAs), Volume Weighted Average Price (VWAP), and key support/resistance levels to help traders identify trend direction, potential reversal points, and optimal entry/exit opportunities.
#### Key Features
1. **Multi-Timeframe Analysis System**
- 2-minute EMAs (13, 48) for ultra-short-term trend identification
- 5-minute EMAs (9, 13, 21, 48, 200) for short-term trend confirmation
- Daily EMAs (5, 13, 21, 48, 100, 200) and MAs (20, 50, 100, 200) for longer-term perspective
- Color-coded bands between key EMAs to visually identify trend strength and direction
2. **Advanced VWAP Integration**
- Daily VWAP for intraday support/resistance
- Weekly VWAP for medium-term price reference
- Monthly VWAP for long-term institutional price levels
- All VWAPs properly reset at their respective time period boundaries
3. **Critical Price Level Identification**
- Previous day high/low lines for identifying key breakout and breakdown levels
- Pre-market high/low tracking to identify potential intraday support/resistance zones
- All levels displayed with distinct line styles for easy identification
4. **Dynamic Trend Analysis**
- Color-coded bands between EMAs display trend strength and direction:
- Green bands indicate uptrend conditions (9 EMA > 21 EMA > 48 EMA)
- Red bands indicate downtrend conditions (9 EMA < 21 EMA < 48 EMA)
- Yellow bands indicate neutral/confused market conditions
- Visual representation makes trend changes immediately apparent
5. **Comprehensive Customization Options**
- Fully customizable colors for all indicators and bands
- Adjustable transparency settings for visual clarity
- Optional price labels with customizable placement and appearance
- Ability to show/hide specific components based on trading preferences
#### Trading Applications
This indicator is particularly valuable for:
1. **Day Trading & Scalping**: The 2-minute and 5-minute EMAs with color bands provide clear short-term trend direction and potential reversal signals.
2. **Swing Trading**: Daily EMAs and MAs offer perspective on the larger trend, helping to align short-term trades with the broader market direction.
3. **Gap Trading**: Previous day and pre-market levels help identify potential gap fill scenarios and breakout/breakdown opportunities.
4. **VWAP Trading Strategies**: Multiple timeframe VWAPs allow for identifying institutional participation levels and potential reversal zones.
5. **EMA Cross Systems**: The various EMAs can be used to identify golden crosses and death crosses across multiple timeframes.
#### How the Components Work Together
The power of NasyI comes from the integration of these different technical elements:
1. The short-timeframe EMAs (2m, 5m) provide immediate trend information, while the daily EMAs/MAs provide context about the larger market structure.
2. The color bands between EMAs offer instant visual confirmation of trend alignment or divergence across timeframes.
3. Previous day and pre-market levels add horizontal support/resistance zones to complement the dynamic moving averages.
4. Multiple timeframe VWAPs provide additional confirmation of institutional activity levels and potential reversal points.
By combining these elements, traders can develop a comprehensive market view that integrates price action, trend direction, and key support/resistance levels all in one indicator.
#### Usage Instructions
1. Apply the NasyI indicator to your chart (works best on intraday timeframes from 1-minute to 30-minute).
2. Observe the relationship between price and the various EMAs:
- Price above the 2m/5m EMAs with green bands indicates bullish short-term conditions
- Price below the 2m/5m EMAs with red bands indicates bearish short-term conditions
3. Use the daily EMAs/MAs and VWAPs as targets for potential price movements and reversal zones.
4. Previous day and pre-market high/low lines provide key levels to watch for breakouts or breakdowns.
5. Customize the appearance according to your preferences using the extensive settings options.
This indicator represents a unique approach to technical analysis by combining multiple timeframe perspectives into a single, visually intuitive display that helps traders make more informed decisions based on a comprehensive view of market conditions.
### 中文描述
**NasyI** 是一个全面的技术分析指标,旨在为交易者提供跨多个时间周期的完整市场动态视图。该指标结合了指数移动平均线(EMA)、简单移动平均线(MA)、成交量加权平均价格(VWAP)和关键支撑/阻力水平的力量,帮助交易者识别趋势方向、潜在反转点和最佳进出场机会。
#### 主要特点
1. **多时间周期分析系统**
- 2分钟EMAs(13,48)用于超短期趋势识别
- 5分钟EMAs(9,13,21,48,200)用于短期趋势确认
- 日线EMAs(5,13,21,48,100,200)和MAs(20,50,100,200)用于更长期的视角
- 关键EMAs之间的彩色带状区域直观显示趋势强度和方向
2. **高级VWAP整合**
- 日内VWAP作为日内支撑/阻力
- 周内VWAP作为中期价格参考
- 月内VWAP作为长期机构价格水平
- 所有VWAP在各自的时间周期边界正确重置
3. **关键价格水平识别**
- 前一交易日高点/低点线用于识别关键突破和跌破水平
- 盘前高点/低点跟踪用于识别潜在的日内支撑/阻力区域
- 所有水平以不同的线条样式显示,便于识别
4. **动态趋势分析**
- EMAs之间的彩色带状区域显示趋势强度和方向:
- 绿色带状区域表示上升趋势(9 EMA > 21 EMA > 48 EMA)
- 红色带状区域表示下降趋势(9 EMA < 21 EMA < 48 EMA)
- 黄色带状区域表示中性/混乱市场条件
- 视觉表示使趋势变化立即显现
5. **全面的自定义选项**
- 所有指标和带状区域的颜色完全可定制
- 可调节的透明度设置,提高视觉清晰度
- 可选的价格标签,带有可定制的位置和外观
- 能够根据交易偏好显示/隐藏特定组件
#### 交易应用
此指标对以下方面特别有价值:
1. **日内交易和短线交易**:2分钟和5分钟EMAs与色带提供清晰的短期趋势方向和潜在反转信号。
2. **摇摆交易**:日线EMAs和MAs提供对更大趋势的视角,帮助将短期交易与更广泛的市场方向对齐。
3. **缺口交易**:前一日和盘前水平帮助识别潜在的缺口填充情况和突破/跌破机会。
4. **VWAP交易策略**:多时间周期VWAP允许识别机构参与水平和潜在反转区域。
5. **EMA交叉系统**:各种EMAs可用于识别跨多个时间周期的黄金交叉和死亡交叉。
#### 组件如何协同工作
NasyI的强大之处在于这些不同技术元素的集成:
1. 短时间周期EMAs(2m,5m)提供即时趋势信息,而日线EMAs/MAs提供关于更大市场结构的背景。
2. EMAs之间的色带提供趋势对齐或跨时间周期分歧的即时视觉确认。
3. 前一日和盘前水平添加水平支撑/阻力区域,补充动态移动平均线。
4. 多时间周期VWAP提供机构活动水平和潜在反转点的额外确认。
通过结合这些元素,交易者可以发展出全面的市场视图,整合价格行动、趋势方向和关键支撑/阻力水平于一个指标中。
#### 使用说明
1. 将NasyI指标应用到您的图表上(最适合1分钟至30分钟的日内时间周期)。
2. 观察价格与各种EMAs之间的关系:
- 价格位于2m/5m EMAs之上,带有绿色带状区域,表示看涨的短期条件
- 价格位于2m/5m EMAs之下,带有红色带状区域,表示看跌的短期条件
3. 使用日线EMAs/MAs和VWAPs作为潜在价格移动和反转区域的目标。
4. 前一日和盘前高点/低点线提供需要关注的突破或跌破的关键水平。
5. 使用广泛的设置选项根据您的偏好自定义外观。
这个指标代表了一种独特的技术分析方法,将多个时间周期的视角结合到一个单一的、视觉直观的显示中,帮助交易者基于对市场条件的全面视图做出更明智的决策。

Cometreon_Public📚 Cometreon Public Library – Advanced Functions for Pine Script
This library contains advanced functions used in my public indicators on TradingView. The goal is to make the code more modular and efficient, allowing users to call pre-built functions for complex calculations without rewriting them from scratch.
🔹 Currently Available Functions:
1️⃣ Moving Average Function – Provides multiple types of moving averages to choose from, including:
SMA (Simple Moving Average)
EMA (Exponential Moving Average)
WMA (Weighted Moving Average)
RMA (Smoothed Moving Average)
HMA (Hull Moving Average)
JMA (Jurik Moving Average)
DEMA (Double Exponential Moving Average)
TEMA (Triple Exponential Moving Average)
LSMA (Least Squares Moving Average)
VWMA (Volume-Weighted Moving Average)
SMMA (Smoothed Moving Average)
KAMA (Kaufman’s Adaptive Moving Average)
ALMA (Arnaud Legoux Moving Average)
FRAMA (Fractal Adaptive Moving Average)
VIDYA (Variable Index Dynamic Average)
2️⃣ Custom RSI – Uses the Moving Average function to modify the calculation method, with an additional option for a dynamic version.
3️⃣ Custom MACD – Uses the Moving Average function to modify the calculation method, with an additional option for a dynamic version.
4️⃣ Custom Alligator – Uses the Moving Average function to modify generic calculations, allowing users to change the calculation method.

[blackcat] L2 Enhanced MACD Trend█ OVERVIEW
The Enhanced MACD Trend script combines traditional Moving Average Convergence Divergence (MACD) analysis with On-Balance Volume (OBV) insights to provide traders with a comprehensive understanding of market trends. By examining both price momentum and volume fluctuations, this tool aids in identifying potential upward or downward market transitions.
█ LOGICAL FRAMEWORK
Initially, the script prompts users to configure fundamental parameters such as the speed of moving averages. It subsequently utilizes a specialized auxiliary function named calculate_macd_obv_signals to perform intricate computations. This function calculates the discrepancy between two distinct types of moving averages (captured via MACD analysis), evaluates the direction of capital inflows and outflows within securities (using OBV), and applies smoothing techniques to mitigate undue influence from minor fluctuations. Ultimately, visual representations of these calculations are rendered on an additional chart pane for enhanced interpretability.
█ CUSTOM FUNCTIONS
Function: calculate_macd_obv_signals
• Purpose: Determines critical aspects associated with MACD and OBV.
• Parameters:
• fastLength (int): Dictates the responsiveness of the shorter Exponential Moving Average (EMA) to price variations.
• slowLength (int): Specifies the reactivity of the longer EMA.
• signalSmoothing (int): Defines the degree of smoothness applied to the divergence between EMAs.
• Functionality:
• macd_diff: Illustrates whether price increases have accelerated relative to previous levels or decelerated, providing insight into existing momentum.
• macd_signal_line: Smoothens macd_diff values, serving akin to a trailing indicator for macd_diff.
• macd_histogram: Visually accentuates disparities between macd_diff and macd_signal_line employing color-coded bars, facilitating identification of significant divergences.
• obv_signal: Represents a refined variant of short-term OBV concentrating solely on periods characterized by elevated buying interest, aiding in reduction of extraneous signals.
• moving_average_short: Analyzes recent closing prices across several sessions to corroborate burgeoning bullish or bearish tendencies.
• Returns: An array encompassing .
█ KEY POINTS AND TECHNIQUES
Advanced Features: Employs sophisticated functions including ta.ema() and ta.sma(), enabling accurate calculation of EMAs and SMAs respectively, thus enhancing precision in trend detection.
Optimization Techniques: Incorporates customizable inputs (input.int) permitting strategic adjustments alongside scrutiny of escalating or declining volumes to accurately gauge genuine sentiment shifts while discounting insignificant anomalies.
Best Practices: Maintains separation between algorithmic processes and graphical outputs, preserving organizational clarity; hence simplifying debugging efforts and future enhancements.
Unique Approaches: Integrates multifaceted assessments simultaneously – amalgamating candlestick formations and volumetric activities – offering a holistic perspective instead of reliance on singular indicators. Consequently, delivers astute recommendations grounded in diverse analytical underpinnings rather than speculative forecasts.
█ EXTENDED KNOWLEDGE AND APPLICATIONS
Potential Modifications:
1 — Implement automated alert mechanisms signaling crossover events pinpointing optimal buy/sell junctures to fine-tune timing preemptively minimizing losses proactively.
2 — Enable user customization of sensitivity criteria governing trigger intensity thereby eliminating trivial aberrations and emphasizing substantial patterns exclusively.
Application Scenarios:
Beneficial for high-frequency trading aiming to capitalize on fleeting price movements swiftly. Suitable for dynamic environments necessitating rapid responses due to frequent market volatility demanding prompt reactions. Perfect for individuals engaging in regular transactions seeking unparalleled accuracy navigating fluctuating circumstances ensuring consistent profitability amidst disturbances maintaining steady yields irrespective of upheavals.
Related Concepts:
Contemplate interactions among oscillators (such as MACD) and volume metrics detecting instances wherein they oppose each other (indicative of divergences) or concur (signaling crossovers). Profound comprehension of these interrelationships substantially refines trading strategies integrating broader economic factors, seasonal influences guiding overarching plans resulting in heightened predictive capabilities elevating trading effectiveness leveraging cumulative information transforming unprocessed statistics into actionable intelligence empowering informed decisions advancing confidently toward objectives effortlessly scaling achievements seamlessly realizing aspirations effortlessly.

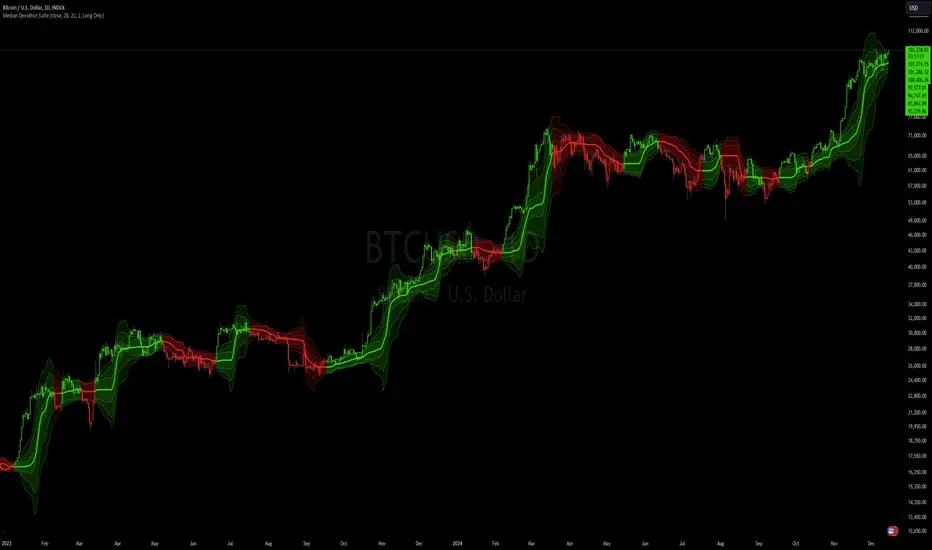
Median Deviation Suite [InvestorUnknown]The Median Deviation Suite uses a median-based baseline derived from a Double Exponential Moving Average (DEMA) and layers multiple deviation measures around it. By comparing price to these deviation-based ranges, it attempts to identify trends and potential turning points in the market. The indicator also incorporates several deviation types—Average Absolute Deviation (AAD), Median Absolute Deviation (MAD), Standard Deviation (STDEV), and Average True Range (ATR)—allowing traders to visualize different forms of volatility and dispersion. Users should calibrate the settings to suit their specific trading approach, as the default values are not optimized.
Core Components
Median of a DEMA:
The foundation of the indicator is a Median applied to the 7-day DEMA (Double Exponential Moving Average). DEMA aims to reduce lag compared to simple or exponential moving averages. By then taking a median over median_len periods of the DEMA values, the indicator creates a robust and stable central tendency line.
float dema = ta.dema(src, 7)
float median = ta.median(dema, median_len)
Multiple Deviation Measures:
Around this median, the indicator calculates several measures of dispersion:
ATR (Average True Range): A popular volatility measure.
STDEV (Standard Deviation): Measures the spread of price data from its mean.
MAD (Median Absolute Deviation): A robust measure of variability less influenced by outliers.
AAD (Average Absolute Deviation): Similar to MAD, but uses the mean absolute deviation instead of median.
Average of Deviations (avg_dev): The average of the above four measures (ATR, STDEV, MAD, AAD), providing a combined sense of volatility.
Each measure is multiplied by a user-defined multiplier (dev_mul) to scale the width of the bands.
aad = f_aad(src, dev_len, median) * dev_mul
mad = f_mad(src, dev_len, median) * dev_mul
stdev = ta.stdev(src, dev_len) * dev_mul
atr = ta.atr(dev_len) * dev_mul
avg_dev = math.avg(aad, mad, stdev, atr)
Deviation-Based Bands:
The indicator creates multiple upper and lower lines based on each deviation type. For example, using MAD:
float mad_p = median + mad // already multiplied by dev_mul
float mad_m = median - mad
Similar calculations are done for AAD, STDEV, ATR, and the average of these deviations. The indicator then determines the overall upper and lower boundaries by combining these lines:
float upper = f_max4(aad_p, mad_p, stdev_p, atr_p)
float lower = f_min4(aad_m, mad_m, stdev_m, atr_m)
float upper2 = f_min4(aad_p, mad_p, stdev_p, atr_p)
float lower2 = f_max4(aad_m, mad_m, stdev_m, atr_m)
This creates a layered structure of volatility envelopes. Traders can observe which layers price interacts with to gauge trend strength.
Determining Trend
The indicator generates trend signals by assessing where price stands relative to these deviation-based lines. It assigns a trend score by summing individual signals from each deviation measure. For instance, if price crosses above the MAD-based upper line, it contributes a bullish point; crossing below an ATR-based lower line contributes a bearish point.
When the aggregated trend score crosses above zero, it suggests a shift towards a bullish environment; crossing below zero indicates a bearish bias.
// Define Trend scores
var int aad_t = 0
if ta.crossover(src, aad_p)
aad_t := 1
if ta.crossunder(src, aad_m)
aad_t := -1
var int mad_t = 0
if ta.crossover(src, mad_p)
mad_t := 1
if ta.crossunder(src, mad_m)
mad_t := -1
var int stdev_t = 0
if ta.crossover(src, stdev_p)
stdev_t := 1
if ta.crossunder(src, stdev_m)
stdev_t := -1
var int atr_t = 0
if ta.crossover(src, atr_p)
atr_t := 1
if ta.crossunder(src, atr_m)
atr_t := -1
var int adev_t = 0
if ta.crossover(src, adev_p)
adev_t := 1
if ta.crossunder(src, adev_m)
adev_t := -1
int upper_t = src > upper ? 3 : 0
int lower_t = src < lower ? 0 : -3
int upper2_t = src > upper2 ? 1 : 0
int lower2_t = src < lower2 ? 0 : -1
float trend = aad_t + mad_t + stdev_t + atr_t + adev_t + upper_t + lower_t + upper2_t + lower2_t
var float sig = 0
if ta.crossover(trend, 0)
sig := 1
else if ta.crossunder(trend, 0)
sig := -1
Practical Usage and Calibration
Default settings are not optimized: The given parameters serve as a starting point for demonstration. Users should adjust:
median_len: Affects how smooth and lagging the median of the DEMA is.
dev_len and dev_mul: Influence the sensitivity of the deviation measures. Larger multipliers widen the bands, potentially reducing false signals but introducing more lag. Smaller multipliers tighten the bands, producing quicker signals but potentially more whipsaws.
This flexibility allows the trader to tailor the indicator for various markets (stocks, forex, crypto) and time frames.
Backtesting and Performance Metrics
The code integrates with a backtesting library that allows traders to:
Evaluate the strategy historically
Compare the indicator’s signals with a simple buy-and-hold approach
Generate performance metrics (e.g., mean returns, Sharpe Ratio, Sortino Ratio) to assess historical effectiveness.
Disclaimer
No guaranteed results: Historical performance does not guarantee future outcomes. Market conditions can vary widely.
User responsibility: Traders should combine this indicator with other forms of analysis, appropriate risk management, and careful calibration of parameters.
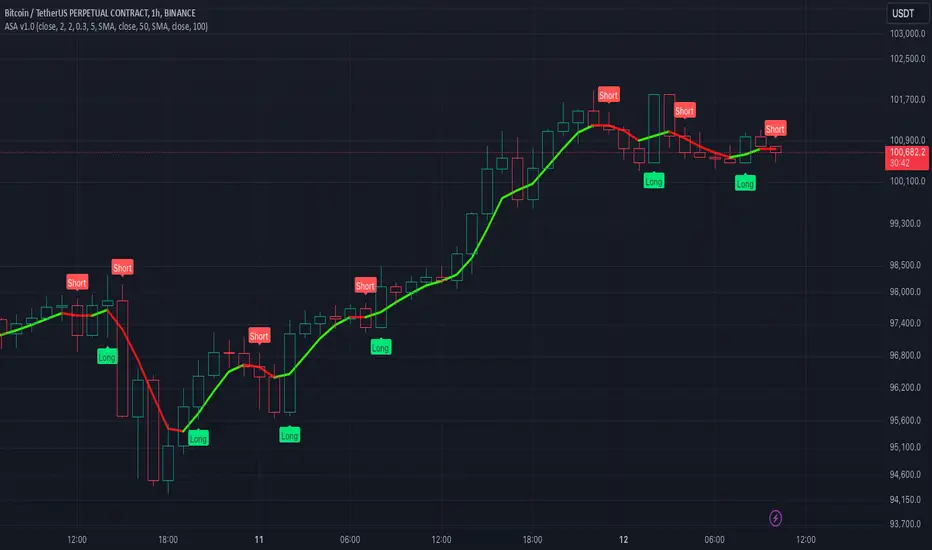
Algorithmic Signal AnalyzerMeet Algorithmic Signal Analyzer (ASA) v1: A revolutionary tool that ushers in a new era of clarity and precision for both short-term and long-term market analysis, elevating your strategies to the next level.
ASA is an advanced TradingView indicator designed to filter out noise and enhance signal detection using mathematical models. By processing price movements within defined standard deviation ranges, ASA produces a smoothed analysis based on a Weighted Moving Average (WMA). The Volatility Filter ensures that only relevant price data is retained, removing outliers and improving analytical accuracy.
While ASA provides significant analytical advantages, it’s essential to understand its capabilities in both short-term and long-term use cases. For short-term trading, ASA excels at capturing swift opportunities by highlighting immediate trend changes. Conversely, in long-term trading, it reveals the overall direction of market trends, enabling traders to align their strategies with prevailing conditions.
Despite these benefits, traders must remember that ASA is not designed for precise trade execution systems where accuracy in timing and price levels is critical. Its focus is on analysis rather than order management. The distinction is crucial: ASA helps interpret price action effectively but may not account for real-time market factors such as slippage or execution delays.
Features and Functionality
ASA integrates multiple tools to enhance its analytical capabilities:
Customizable Moving Averages: SMA, EMA, and WMA options allow users to tailor the indicator to their trading style.
Signal Detection: Identifies bullish and bearish trends using the Relative Exponential Moving Average (REMA) and marks potential buy/sell opportunities.
Visual Aids: Color-coded trend lines (green for upward, red for downward) simplify interpretation.
Alert System: Notifications for trend swings and reversals enable timely decision-making.
Notes on Usage
ASA’s effectiveness depends on the context in which it is applied. Traders should carefully consider the trade-offs between analysis and execution.
Results may vary depending on market conditions and chart types. Backtesting with ASA on standard charts provides more reliable insights compared to non-standard chart types.
Short-term use focuses on rapid trend recognition, while long-term application emphasizes understanding broader market movements.
Takeaways
ASA is not a tool for precise trade execution but a powerful aid for interpreting price trends.
For short-term trading, ASA identifies quick opportunities, while for long-term strategies, it highlights trend directions.
Understanding ASA’s limitations and strengths is key to maximizing its utility.
ASA is a robust solution for traders seeking to filter noise, enhance analytical clarity, and align their strategies with market movements, whether for short bursts of activity or sustained trading goals.
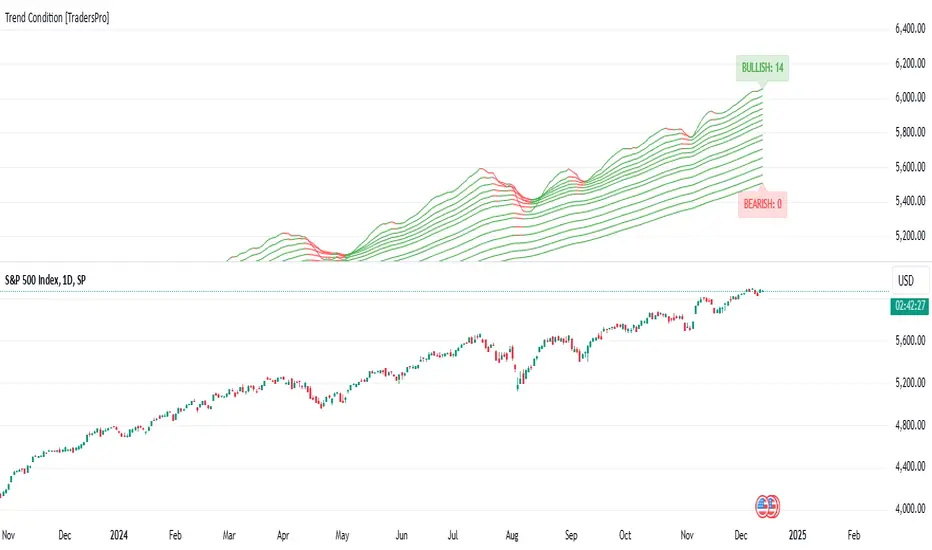
Trend Condition [TradersPro]
OVERVIEW
The Trend Condition Indicator measures the strength of the bullish or bearish trend by using a ribbon pattern of exponential moving averages and scoring system. Trend cycles naturally expand and contract as a normal part of the cycle. It is the rhythm of the market. Perpetual expansion and contraction of trend.
As trend cycles develop the indicator shows a compression of the averages. These compression zones are key locations as trends typically expand from there. The expansion of trend can be up or down.
As the trend advances the ribbon effect of the indicator can be seen as each average expands with the price action. Once they have “fanned” the probability of the current trend slowing is high.
This can be used to recognize a powerful trend may be concluding. Traders can tighten stops, exit positions or utilize other prudent strategies.
CONCEPTS
Each line will display green if it is higher than the prior period and red if it is lower than the prior period. If the average is green it is considered bullish and will score one point in the bullish display. Red lines are considered bearish and will score one point in the bearish display.
The indicator can then be used at a quick glance to see the number of averages that are bullish and the number that are bearish.
A trader may use these on any tradable instrument. They can be helpful in stock portfolio management when used with an index like the S&P 500 to determine the strength of the current market trend. This may affect trade decisions like possession size, stop location and other risk factors.
Precision Trading Strategy: Golden EdgeThe PTS: Golden Edge strategy is designed for scalping Gold (XAU/USD) on lower timeframes, such as the 1-minute chart. It captures high-probability trade setups by aligning with strong trends and momentum, while filtering out low-quality trades during consolidation or low-volatility periods.
The strategy uses a combination of technical indicators to identify optimal entry points:
1. Exponential Moving Averages (EMAs): A fast EMA (3-period) and a slow EMA (33-period) are used to detect short-term trend reversals via crossover signals.
2. Hull Moving Average (HMA): A 66-period HMA acts as a higher-timeframe trend filter to ensure trades align with the overall market direction.
3. Relative Strength Index (RSI): A 12-period RSI identifies momentum. The strategy requires RSI > 55 for long trades and RSI < 45 for short trades, ensuring entries are backed by strong buying or selling pressure.
4. Average True Range (ATR): A 14-period ATR ensures trades occur only during volatile conditions, avoiding choppy or low-movement markets.
By combining these tools, the PTS: Golden Edge strategy creates a precise framework for scalping and offers a systematic approach to capitalize on Gold’s price movements efficiently.

Nasan Hull-smoothed envelope The Nasan Hull-Smoothed Envelope indicator is a sophisticated overlay designed to track price movement within an adaptive "envelope." It dynamically adjusts to market volatility and trend strength, using a series of smoothing and volatility-correction techniques. Here's a detailed breakdown of its components, from the input settings to the calculated visual elements:
Inputs
look_back_length (500):
Defines the lookback period for calculating intraday volatility (IDV), smoothing it over time. A higher value means the indicator considers a longer historical range for volatility calculations.
sl (50):
Sets the smoothing length for the Hull Moving Average (HMA). The HMA smooths various lines, creating a balance between sensitivity and stability in trend signals.
mp (1.5):
Multiplier for IDV, scaling the volatility impact on the envelope. A higher multiplier widens the envelope to accommodate higher volatility, while a lower one tightens it.
p (0.625):
Weight factor that determines the balance between extremes (highest high and lowest low) and averages (sma of high and sma of low) in the high/low calculations. A higher p gives more weight to extremes, making the envelope more responsive to abrupt market changes.
Volatility Calculation (IDV)
The Intraday Volatility (IDV) metric represents the average volatility per bar as an exponentially smoothed ratio of the high-low range to the close price. This is calculated over the look_back_length period, providing a base volatility value which is then scaled by mp. The IDV enables the envelope to dynamically widen or narrow with market volatility, making it sensitive to current market conditions.
Composite High and Low Bands
The high and low bands define the upper and lower bounds of the envelope.
High Calculation
a_high:
Uses a multi-period approach to capture the highest highs over several intervals (5, 8, 13, 21, and 34 bars). Averaging these highs provides a more stable reference for the high end of the envelope, capturing both immediate and recent peak values.
b_high:
Computes the average of shorter simple moving averages (5, 8, and 13 bars) of the high prices, smoothing out fluctuations in the recent highs. This generates a balanced view of high price trends.
high_c:
Combines a_high and b_high using the weight p. This blend creates a composite high that balances between recent peaks and smoothed averages, making the upper envelope boundary adaptive to short-term price shifts.
Low Calculation
a_low and b_low:
Similar to the high calculation, these capture extreme lows and smooth low values over the same intervals. This approach creates a stable and adaptive lower bound for the envelope.
low_c:
Combines a_low and b_low using the weight p, resulting in a composite low that adjusts to price fluctuations while maintaining a stable trend line.
Volatility-Adjusted Bands
The final composite high (c_high) and composite low (c_low) bands are adjusted using IDV, which accounts for intraday volatility. When volatility is high, the bands expand; when it’s low, they contract, providing a visual representation of volatility-adjusted price bounds.
Basis Line
The basis line is a Hull Moving Average (HMA) of the average of c_high and c_low. The HMA is known for its smoothness and responsiveness, making the basis line a central trend indicator. The color of the basis line changes:
Green when the basis line is increasing.
Red when the basis line is decreasing.
This color-coded basis line serves as a quick visual reference for trend direction.
Short-Term Trend Strength Block
This component analyzes recent price action to assess short-term bullish and bearish momentum.
Conditions (green, red, green1, red1):
These are binary conditions that categorize price movements as bullish or bearish based on the close compared to the open and the close’s relationship with the exponential moving average (EMA). This separation helps capture different types of strength (above/below EMA) and different bullish or bearish patterns.
Composite Trend Strength Values:
Each of the bullish and bearish counts (above and below the EMA) is normalized, resulting in the following values:
green_EMAup_a and red_EMAup_a for bullish and bearish strength above the EMA.
green_EMAdown_a and red_EMAdown_a for bullish and bearish strength below the EMA.
Trend Strength (t_s):
This calculated metric combines the normalized trend strengths with extra weight to conditions above the EMA, giving more relevance to trends that have momentum behind them.
Enhanced Trend Strength
avg_movement:
Calculates the average absolute price movement over the short_term_length, providing a measurement of recent price activity that scales with volatility.
enhanced_t_s:
Multiplies t_s by avg_movement, creating an enhanced trend strength value that reflects both directional strength and the magnitude of recent price movement.
min and max:
Minimum and maximum percentile thresholds, respectively, based on enhanced_t_s for controlling the color gradient in the fill area.
Fill Area
The fill area between plot_c_high and plot_c_low is color-coded based on the enhanced trend strength (enhanced_t_s):
Gradient color transitions from blue to green based on the strength level, with blue representing weaker trends and green indicating stronger trends.
This visual fill provides an at-a-glance assessment of trend strength across the envelope, with color shifts highlighting momentum shifts.
Summary
The indicator’s purpose is to offer an adaptive price envelope that reflects real-time market volatility and trend strength. Here’s what each component contributes:
Basis Line: A trend-following line in the center that adjusts color based on trend direction.
Envelope (c_high, c_low): Adapts to volatility by expanding and contracting based on IDV, giving traders a responsive view of expected price bounds.
Fill Area: A color-gradient region representing trend strength within the envelope, helping traders easily identify momentum changes.
Overall, this tool helps to identify trend direction, market volatility, and strength of price movements, allowing for more informed decisions based on visual cues around price boundaries and trend momentum.

TechniTrend: Trend and Volume Indicator🟪 Overview
The "TechniTrend: Trend and Volume Indicator" is designed to assist traders in identifying optimal entry and exit points in the market by combining trend detection and volume analysis. This indicator integrates moving average-based trend recognition with volume threshold analysis to provide clear buy and sell signals. Additionally, it includes divergence filtering and correlation analysis to enhance the accuracy of signals, making it suitable for traders who want to identify strong trends and high-probability trading opportunities.
🟪 Indicator Components
🔹Trend Moving Average (MA):
The indicator calculates a moving average based on the closing prices to identify the overall trend. Various moving average types are available for customization:
Simple Moving Average (SMA)
Exponential Moving Average (EMA)
Weighted Moving Average (WMA)
Hull Moving Average (HMA)
The length of the moving average can be adjusted via the Trend MA Length input to adapt to different market conditions.
🔹Volume Analysis:
A volume moving average is calculated over a specified period (Volume MA Length), with a volume threshold derived by multiplying this average by a user-defined Volume Threshold Factor.
This threshold helps to classify volume as either high or low, which plays a crucial role in signal generation.
🔹Divergence Detection:
The indicator can filter out signals when there is a divergence between the price movement and volume changes. Divergence occurs when the price moves in one direction while the volume moves in the opposite direction, indicating a potential weakening of the trend.
🔹Correlation Analysis:
The correlation between price and volume changes is calculated over the same length as the trend moving average. The user can enable this filter to ensure that buy or sell signals are only generated when the correlation exceeds a specified threshold (Correlation Threshold).
🟪 Signals and Alerts
🔹Buy Signal: Generated when the price is above the trend moving average (indicating an uptrend), and the current volume exceeds the volume threshold (indicating high volume). The signal can be filtered based on divergence or correlation settings.
🔹Sell Signal: Triggered when the price is below the trend moving average (indicating a downtrend), and the volume is above the threshold. Similarly, the signal is affected by divergence and correlation filters.
🔹Visual Indicators:
The trend line is plotted on the chart for easy trend identification.
Buy and sell signals are displayed using green and red labels, respectively.
Background highlighting is used to mark areas of high volume on the chart.
🟪 Customizable Inputs
🔹Trend MA Length: Adjusts the moving average length used to detect trends.
🔹Volume MA Length: Sets the length for the volume moving average calculation.
🔹MA Type for Trend: Select the type of moving average for trend detection (SMA, EMA, WMA, HMA).
🔹Volume Threshold Factor: Multiplier used to define high-volume conditions based on the volume moving average.
🔹Enable Divergence Filter: Allows the user to filter out signals where divergence between price and volume is detected.
🔹Enable Correlation Filter: Enables filtering of signals based on the correlation between price and volume changes.
🔹Correlation Threshold: Sets the minimum correlation value required for a signal to be considered valid.
🟪 Alerts
The indicator provides alert conditions for buy and sell signals, allowing traders to receive notifications when new trading opportunities arise.
🟪 Usage Tips
🔹Adjust Moving Average Lengths: Shorter lengths can make the indicator more sensitive to recent market changes, while longer lengths provide a smoother, more reliable trend signal.
🔹Volume Threshold Factor: Increasing this factor raises the volume required to generate high-volume signals, which can help filter.
🟪 Disclaimer:
The "TechniTrend: Trend and Volume Indicator" is a technical analysis tool intended for educational and informational purposes only. It is not a guarantee of future performance or a recommendation to buy, sell, or hold any financial instrument. Trading involves significant risk, and past performance is not indicative of future results. Users should conduct their own research and seek advice from a qualified financial professional before making any investment decisions. The creators of this indicator are not liable for any financial losses or damages incurred through its use.

Tetuan SniperThe TEMA and EMA Crossover Alert with SL, TP, and Order Signal strategy combines the power of Triple Exponential Moving Average (TEMA) and Exponential Moving Average (EMA) to generate high-quality trading signals. This strategy is designed to provide clear entry and exit points, manage risk through dynamic Stop Loss (SL) and Take Profit (TP) levels, and optimize trade sizes based on account balance and risk tolerance.
Key Features:
EMA and TEMA Crossover:
The strategy identifies potential buy and sell signals based on the crossover of EMA and TEMA. A buy signal is generated when TEMA crosses above EMA, and a sell signal is generated when TEMA crosses below EMA.
Dynamic Stop Loss (SL) and Take Profit (TP):
Stop Loss levels are dynamically set based on a user-defined number of pips below (for buy orders) or above (for sell orders) the lowest or highest point since the crossover.
Take Profit levels are dynamically adjusted using another TEMA, providing a flexible exit strategy that adapts to market conditions.
Lot Size Calculation:
The strategy calculates the optimal lot size based on the account balance, risk percentage per trade, and the number of maximum open orders. For JPY pairs, the lot size is adjusted by dividing by 100 to account for the different pip value.
The lot size is rounded to two decimal places for better readability and precision.
Visual Alerts and Labels:
Clear visual alerts and labels are provided for each buy and sell signal, including the recommended SL, TP, and lot size. The labels are placed in a way to avoid overlapping important chart elements.
Trend Visualization:
The area between the TEMA and EMA is colored to indicate the trend, with green for bullish trends and red for bearish trends, making it easy to visualize the market direction.
Inputs:
SL Points: Number of pips for the Stop Loss.
EMA Period: Period for the Exponential Moving Average.
TEMA Period: Period for the Triple Exponential Moving Average.
Account Balance: The total account balance for calculating the lot size.
Risk Percentage: The percentage of the account balance to risk per trade.
Take Profit TEMA Period: Period for the TEMA used to set Take Profit levels.
Lot per Pip Value: The value of 1 pip per lot.
Maximum Open Orders: The maximum number of open orders to split the balance among.
Example Usage
This strategy is suitable for traders who want to automate their trading signals and manage risk effectively. By combining TEMA and EMA crossovers with dynamic SL and TP levels and precise lot size calculation, traders can achieve a disciplined and methodical approach to trading.

Uptrick: Bullish/Bearish Highlight -DEMO 1 Indicator Purpose:
• The indicator serves as a technical analysis tool for traders to identify potential bullish
and bearish trends in the market.
• It highlights periods where the closing price is above or below a 50-period simple
moving average (SMA), indicating potential bullish or bearish sentiment, respectively.
2 Moving Averages:
• The indicator calculates a 50-period SMA (sma50) to smooth out price fluctuations
and identify the overall trend direction.
• It also computes an 8-period exponential moving average (EMA), which responds
more quickly to recent price changes compared to the SMA.
3 Bollinger Bands:
• Bollinger Bands are plotted around the SMA, indicating volatility in the price
movement.
• The bands are typically set at two standard deviations above and below the SMA,
representing approximately 95% of the price data within that range.
4 Bullish and Bearish Conditions:
• The indicator defines conditions for identifying bullish and bearish market sentiments.
• When the closing price is above the SMA50, it indicates a bullish condition, and when
it's below, it suggests a bearish condition.
5 Plotting:
• The indicator visualizes the bullish and bearish conditions by changing the
background color accordingly.
• It also plots the SMA50, EMA, and Bollinger Bands to provide a graphical
representation of the market dynamics.
6 User Interface:
• The indicator is designed to be used as an overlay on price charts, allowing traders to
easily incorporate it into their analysis.
Overall, the "Uptrick: Bullish/Bearish Highlight" indicator offers traders a comprehensive view of market trends and potential reversal points, helping them make informed trading decisions.
TIP: When the white line, which is the EMA , crosses above the SMA (the orange line), it is usually a good idea to buy, but when the EMA crosses below the SMA it is a good idea to sell.
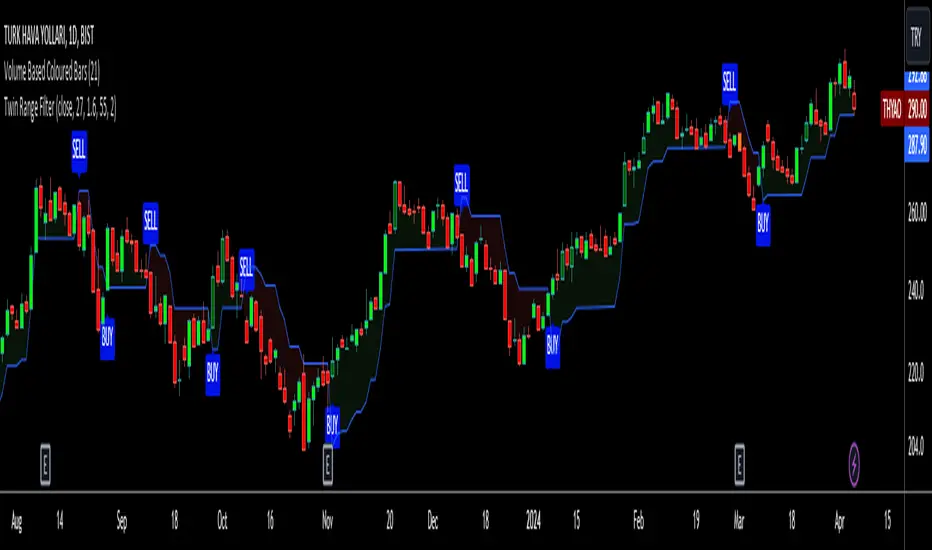
Twin Range Filter VisualizedVisulaized version of @colinmck's Twin Range Filter version on TradingView.
On @colinmck's Twin Range Filter version, you can only see Long and Short signals on the chart.
But in this version of TRF, users can visually see the BUY and SELL signals on the chart with an added line of TRF.
TRF is an average of two smoothed Exponential Moving Averages, fast one has 27 bars of length and the slow one has 55 bars.
The purpose is to obtain two ranges that price fluctuates between (upper and lower range) and have LONG AND SHORT SIGNALS when close price crosses above the upper range and conversely crosses below lower range.
I personally combine the upper and lower ranges on one line to see the long and short signals with my own eyes so,
-BUY when price is higher or equal to the upper range level and the indicator line turns to draw the lower range to follow the price just under the bars as a trailing stop loss indicator like SuperTrend.
-SELL when price is lower or equal to the lower range levelline under the bars and then the indicator line turns to draw the upper range to follow the price just over the bars in that same trailing stop loss logic.
There are also two coefficients that adjusts the trailing line distance levels from the price multiplying the effect of the faster and slower moving averages.
The default values of the multipliers:
Fast range multiplier of Fast Moving Average(27): 1.6
Slow range multiplier of fSlow Moving Average(55): 2
Remember that if you enlarge these multipliers you will enlarge the ranges and have less but lagging signals. Conversely, decreasing the multipliers will have small ranges (line will get closer to the price and more signals will occur)
The Flash-Strategy with Minervini Stage Analysis QualifierThe Flash-Strategy (Momentum-RSI, EMA-crossover, ATR) with Minervini Stage Analysis Qualifier
Introduction
Welcome to a comprehensive guide on a cutting-edge trading strategy I've developed, designed for the modern trader seeking an edge in today's dynamic markets. This strategy, which I've honed through my years of experience in the trading arena, stands out for its unique blend of technical analysis and market intuition, tailored specifically for use on the TradingView platform.
As a trader with a deep passion for the financial markets, my journey began several years ago, driven by a relentless pursuit of a trading methodology that is both effective and adaptable. My background in trading spans various market conditions and asset classes, providing me with a rich tapestry of experiences from which to draw. This strategy is the culmination of that journey, embodying the lessons learned and insights gained along the way.
The cornerstone of this strategy lies in its ability to generate precise long signals in a Stage 2 uptrend and equally accurate short signals in a Stage 4 downtrend. This approach is rooted in the principles of trend following and momentum trading, harnessing the power of key indicators such as the Momentum-RSI, EMA Crossover, and Average True Range (ATR). What sets this strategy apart is its meticulous design, which allows it to adapt to the ever-changing market conditions, providing traders with a robust tool for navigating both bullish and bearish scenarios.
This strategy was born out of a desire to create a trading system that is not only highly effective in identifying potential trade setups but also straightforward enough to be implemented by traders of varying skill levels. It's a reflection of my belief that successful trading hinges on clarity, precision, and disciplined execution. Whether you are a seasoned trader or just beginning your journey, this guide aims to provide you with a comprehensive understanding of how to harness the full potential of this strategy in your trading endeavors.
In the following sections, we will delve deeper into the mechanics of the strategy, its implementation, and how to make the most out of its features. Join me as we explore the nuances of a strategy that is designed to elevate your trading to the next level.
Stage-Specific Signal Generation
A distinctive feature of this trading strategy is its focus on generating long signals exclusively during Stage 2 uptrends and short signals during Stage 4 downtrends. This approach is based on the widely recognized market cycle theory, which divides the market into four stages: Stage 1 (accumulation), Stage 2 (uptrend), Stage 3 (distribution), and Stage 4 (downtrend). By aligning the signal generation with these specific stages, the strategy aims to capitalize on the most dynamic and clear-cut market movements, thereby enhancing the potential for profitable trades.
1. Long Signals in Stage 2 Uptrends
• Characteristics of Stage 2: Stage 2 is characterized by a strong uptrend, where prices are consistently rising. This stage typically follows a period of accumulation (Stage 1) and is marked by increased investor interest and bullish sentiment in the market.
• Criteria for Long Signal Generation: Long signals are generated during this stage when the technical indicators align with the characteristics of a Stage 2 uptrend.
• Rationale for Stage-Specific Signals: By focusing on Stage 2 for long trades, the strategy seeks to enter positions during the phase of strong upward momentum, thus riding the wave of rising prices and investor optimism. This stage-specific approach minimizes exposure to less predictable market phases, like the consolidation in Stage 1 or the indecision in Stage 3.
2. Short Signals in Stage 4 Downtrends
• Characteristics of Stage 4: Stage 4 is identified by a pronounced downtrend, with declining prices indicating prevailing bearish sentiment. This stage typically follows the distribution phase (Stage 3) and is characterized by increasing selling pressure.
• Criteria for Short Signal Generation: Short signals are generated in this stage when the indicators reflect a strong bearish trend.
• Rationale for Stage-Specific Signals: Targeting Stage 4 for shorting capitalizes on the market's downward momentum. This tactic aligns with the natural market cycle, allowing traders to exploit the downward price movements effectively. By doing so, the strategy avoids the potential pitfalls of shorting during the early or late stages of the market cycle, where trends are less defined and more susceptible to reversals.
In conclusion, the strategy’s emphasis on stage-specific signal generation is a testament to its sophisticated understanding of market dynamics. By tailoring the long and short signals to Stages 2 and 4, respectively, it leverages the most compelling phases of the market cycle, offering traders a clear and structured approach to aligning their trades with dominant market trends.
Strategy Overview
At the heart of this trading strategy is a philosophy centered around capturing market momentum and trend efficiency. The core objective is to identify and capitalize on clear uptrends and downtrends, thereby allowing traders to position themselves in sync with the market's prevailing direction. This approach is grounded in the belief that aligning trades with these dominant market forces can lead to more consistent and profitable outcomes.
The strategy is built on three foundational components, each playing a critical role in the decision-making process:
1. Momentum-RSI (Relative Strength Index): The Momentum-RSI is a pivotal element of this strategy. It's an enhanced version of the traditional RSI, fine-tuned to better capture the strength and velocity of market trends. By measuring the speed and change of price movements, the Momentum-RSI provides invaluable insights into whether a market is potentially overbought or oversold, suggesting possible entry and exit points. This indicator is especially effective in filtering out noise and focusing on substantial market moves.
2. EMA (Exponential Moving Average) Crossover: The EMA Crossover is a crucial component for trend identification. This strategy employs two EMAs with different timeframes to determine the market trend. When the shorter-term EMA crosses above the longer-term EMA, it signals an emerging uptrend, suggesting a potential long entry. Conversely, a crossover below indicates a possible downtrend, hinting at a short entry opportunity. This simple yet powerful tool is key in confirming trend directions and timing market entries.
3. ATR (Average True Range): The ATR is instrumental in assessing market volatility. This indicator helps in understanding the average range of price movements over a given period, thus providing a sense of how much a market might move on a typical day. In this strategy, the ATR is used to adjust stop-loss levels and to gauge the potential risk and reward of trades. It allows for more informed decisions by aligning trade management techniques with the current volatility conditions.
The synergy of these three components – the Momentum-RSI, EMA Crossover, and ATR – creates a robust framework for this trading strategy. By combining momentum analysis, trend identification, and volatility assessment, the strategy offers a comprehensive approach to navigating the markets. Whether it's capturing a strong trend in its early stages or identifying a potential reversal, this strategy aims to provide traders with the tools and insights needed to make well-informed, strategically sound trading decisions.
Detailed Component Analysis
The efficacy of this trading strategy hinges on the synergistic functioning of its three key components: the Momentum-RSI, EMA Crossover, and Average True Range (ATR). Each component brings a unique perspective to the strategy, contributing to a well-rounded approach to market analysis.
1. Momentum-RSI (Relative Strength Index)
• Definition and Function: The Momentum-RSI is a modified version of the classic Relative Strength Index. While the traditional RSI measures the velocity and magnitude of directional price movements, the Momentum-RSI amplifies aspects that reflect trend strength and momentum.
• Significance in Identifying Trend Strength: This indicator excels in identifying the strength behind a market's move. A high Momentum-RSI value typically indicates strong bullish momentum, suggesting the potential continuation of an uptrend. Conversely, a low Momentum-RSI value signals strong bearish momentum, possibly indicative of an ongoing downtrend.
• Application in Strategy: In this strategy, the Momentum-RSI is used to gauge the underlying strength of market trends. It helps in filtering out minor fluctuations and focusing on significant movements, providing a clearer picture of the market's true momentum.
2. EMA (Exponential Moving Average) Crossover
• Definition and Function: The EMA Crossover component utilizes two exponential moving averages of different timeframes. Unlike simple moving averages, EMAs give more weight to recent prices, making them more responsive to new information.
• Contribution to Market Direction: The interaction between the short-term and long-term EMAs is key to determining market direction. A crossover of the shorter EMA above the longer EMA is an indicator of an emerging uptrend, while a crossover below signals a developing downtrend.
• Application in Strategy: The EMA Crossover serves as a trend confirmation tool. It provides a clear, visual representation of the market's direction, aiding in the decision-making process for entering long or short positions. This component ensures that trades are aligned with the prevailing market trend, a crucial factor for the success of the strategy.
3. ATR (Average True Range)
• Definition and Function: The ATR is an indicator that measures market volatility by calculating the average range between the high and low prices over a specified period.
• Role in Assessing Market Volatility: The ATR provides insights into the typical market movement within a given timeframe, offering a measure of the market's volatility. Higher ATR values indicate increased volatility, while lower values suggest a calmer market environment.
• Application in Strategy: Within this strategy, the ATR is instrumental in tailoring risk management techniques, particularly in setting stop-loss levels. By accounting for the market's volatility, the ATR ensures that stop-loss orders are placed at levels that are neither too tight (risking premature exits) nor too loose (exposing to excessive risk).
In summary, the combination of Momentum-RSI, EMA Crossover, and ATR in this trading strategy provides a comprehensive toolkit for market analysis. The Momentum-RSI identifies the strength of market trends, the EMA Crossover confirms the market direction, and the ATR guides in risk management by assessing volatility. Together, these components form the backbone of a strategy designed to navigate the complexities of the financial markets effectively.
1. Signal Generation Process
• Combining Indicators: The strategy operates by synthesizing signals from the Momentum-RSI, EMA Crossover, and ATR indicators. Each indicator serves a specific purpose: the Momentum-RSI gauges trend momentum, the EMA Crossover identifies the trend direction, and the ATR assesses the market’s volatility.
• Criteria for Signal Validation: For a signal to be considered valid, it must meet specific criteria set by each of the three indicators. This multi-layered approach ensures that signals are not only based on one aspect of market behavior but are a result of a comprehensive analysis.
2. Conditions for Long Positions
• Uptrend Confirmation: A long position signal is generated when the shorter-term EMA crosses above the longer-term EMA, indicating an uptrend.
• Momentum-RSI Alignment: Alongside the EMA crossover, the Momentum-RSI should indicate strong bullish momentum. This is typically represented by the Momentum-RSI being at a high level, confirming the strength of the uptrend.
• ATR Consideration: The ATR is used to fine-tune the entry point and set an appropriate stop-loss level. In a low volatility scenario, as indicated by the ATR, the stop-loss can be set tighter, closer to the entry point.
3. Conditions for Short Positions
• Downtrend Confirmation: Conversely, a short position signal is indicated when the shorter-term EMA crosses below the longer-term EMA, signaling a downtrend.
• Momentum-RSI Confirmation: The Momentum-RSI should reflect strong bearish momentum, usually seen when the Momentum-RSI is at a low level. This confirms the bearish strength of the market.
• ATR Application: The ATR again plays a role in determining the stop-loss level for the short position. Higher volatility, as indicated by a higher ATR, would warrant a wider stop-loss to accommodate larger market swings.
By adhering to these mechanics, the strategy aims to ensure that each trade is entered with a high probability of success, aligning with the market’s current momentum and trend. The integration of these indicators allows for a holistic market analysis, providing traders with clear and actionable signals for both entering and exiting trades.
Customizable Parameters in the Strategy
Flexibility and adaptability are key features of this trading strategy, achieved through a range of customizable parameters. These parameters allow traders to tailor the strategy to their individual trading style, risk tolerance, and specific market conditions. By adjusting these parameters, users can fine-tune the strategy to optimize its performance and align it with their unique trading objectives. Below are the primary parameters that can be customized within the strategy:
1. Momentum-RSI Settings
• Period: The lookback period for the Momentum-RSI can be adjusted. A shorter period makes the indicator more sensitive to recent price changes, while a longer period smoothens the RSI line, offering a broader view of the momentum.
• Overbought/Oversold Thresholds: Users can set their own overbought and oversold levels, which can help in identifying extreme market conditions more precisely according to their trading approach.
2. EMA Crossover Settings
• Timeframes for EMAs: The strategy uses two EMAs with different timeframes. Traders can modify these timeframes, choosing shorter periods for a more responsive approach or longer periods for a more conservative one.
• Source Data: The choice of price data (close, open, high, low) used in calculating the EMAs can be varied depending on the trader’s preference.
3. ATR Settings
• Lookback Period: Adjusting the lookback period for the ATR impacts how the indicator measures volatility. A longer period may provide a more stable but less responsive measure, while a shorter period offers quicker but potentially more erratic readings.
• Multiplier for Stop-Loss Calculation: This parameter allows traders to set how aggressively or conservatively they want their stop-loss to be in relation to the ATR value.
Here are the standard settings:

Supertrend Advance Pullback StrategyHandbook for the Supertrend Advance Strategy
1. Introduction
Purpose of the Handbook:
The main purpose of this handbook is to serve as a comprehensive guide for traders and investors who are looking to explore and harness the potential of the Supertrend Advance Strategy. In the rapidly changing financial market, having the right tools and strategies at one's disposal is crucial. Whether you're a beginner hoping to dive into the world of trading or a seasoned investor aiming to optimize and diversify your portfolio, this handbook offers the insights and methodologies you need. By the end of this guide, readers should have a clear understanding of how the Supertrend Advance Strategy works, its benefits, potential pitfalls, and practical application in various trading scenarios.
Overview of the Supertrend Advance Pullback Strategy:
At its core, the Supertrend Advance Strategy is an evolution of the popular Supertrend Indicator. Designed to generate buy and sell signals in trending markets, the Supertrend Indicator has been a favorite tool for many traders around the world. The Advance Strategy, however, builds upon this foundation by introducing enhanced mechanisms, filters, and methodologies to increase precision and reduce false signals.
1. Basic Concept:
The Supertrend Advance Strategy relies on a combination of price action and volatility to determine the potential trend direction. By assessing the average true range (ATR) in conjunction with specific price points, this strategy aims to highlight the potential starting and ending points of market trends.
2. Methodology:
Unlike the traditional Supertrend Indicator, which primarily focuses on closing prices and ATR, the Advance Strategy integrates other critical market variables, such as volume, momentum oscillators, and perhaps even fundamental data, to validate its signals. This multidimensional approach ensures that the generated signals are more reliable and are less prone to market noise.
3. Benefits:
One of the main benefits of the Supertrend Advance Strategy is its ability to filter out false breakouts and minor price fluctuations, which can often lead to premature exits or entries in the market. By waiting for a confluence of factors to align, traders using this advanced strategy can increase their chances of entering or exiting trades at optimal points.
4. Practical Applications:
The Supertrend Advance Strategy can be applied across various timeframes, from intraday trading to swing trading and even long-term investment scenarios. Furthermore, its flexible nature allows it to be tailored to different asset classes, be it stocks, commodities, forex, or cryptocurrencies.
In the subsequent sections of this handbook, we will delve deeper into the intricacies of this strategy, offering step-by-step guidelines on its application, case studies, and tips for maximizing its efficacy in the volatile world of trading.
As you journey through this handbook, we encourage you to approach the Supertrend Advance Strategy with an open mind, testing and tweaking it as per your personal trading style and risk appetite. The ultimate goal is not just to provide you with a new tool but to empower you with a holistic strategy that can enhance your trading endeavors.
2. Getting Started
Navigating the financial markets can be a daunting task without the right tools. This section is dedicated to helping you set up the Supertrend Advance Strategy on one of the most popular charting platforms, TradingView. By following the steps below, you'll be able to integrate this strategy into your charts and start leveraging its insights in no time.
Setting up on TradingView:
TradingView is a web-based platform that offers a wide range of charting tools, social networking, and market data. Before you can apply the Supertrend Advance Strategy, you'll first need a TradingView account. If you haven't set one up yet, here's how:
1. Account Creation:
• Visit TradingView's official website.
• Click on the "Join for free" or "Sign up" button.
• Follow the registration process, providing the necessary details and setting up your login credentials.
2. Navigating the Dashboard:
• Once logged in, you'll be taken to your dashboard. Here, you'll see a variety of tools, including watchlists, alerts, and the main charting window.
• To begin charting, type in the name or ticker of the asset you're interested in the search bar at the top.
3. Configuring Chart Settings:
• Before integrating the Supertrend Advance Strategy, familiarize yourself with the chart settings. This can be accessed by clicking the 'gear' icon on the top right of the chart window.
• Adjust the chart type, time intervals, and other display settings to your preference.
Integrating the Strategy into a Chart:
Now that you're set up on TradingView, it's time to integrate the Supertrend Advance Strategy.
1. Accessing the Pine Script Editor:
• Located at the top-center of your screen, you'll find the "Pine Editor" tab. Click on it.
• This is where custom strategies and indicators are scripted or imported.
2. Loading the Supertrend Advance Strategy Script:
• Depending on whether you have the script or need to find it, there are two paths:
• If you have the script: Copy the Supertrend Advance Strategy script, and then paste it into the Pine Editor.
• If searching for the script: Click on the “Indicators” icon (looks like a flame) at the top of your screen, and then type “Supertrend Advance Strategy” in the search bar. If available, it will show up in the list. Simply click to add it to your chart.
3. Applying the Strategy:
• After pasting or selecting the Supertrend Advance Strategy in the Pine Editor, click on the “Add to Chart” button located at the top of the editor. This will overlay the strategy onto your main chart window.
4. Configuring Strategy Settings:
• Once the strategy is on your chart, you'll notice a small settings ('gear') icon next to its name in the top-left of the chart window. Click on this to access settings.
• Here, you can adjust various parameters of the Supertrend Advance Strategy to better fit your trading style or the specific asset you're analyzing.
5. Interpreting Signals:
• With the strategy applied, you'll now see buy/sell signals represented on your chart. Take time to familiarize yourself with how these look and behave over various timeframes and market conditions.
3. Strategy Overview
What is the Supertrend Advance Strategy?
The Supertrend Advance Strategy is a refined version of the classic Supertrend Indicator, which was developed to aid traders in spotting market trends. The strategy utilizes a combination of data points, including average true range (ATR) and price momentum, to generate buy and sell signals.
In essence, the Supertrend Advance Strategy can be visualized as a line that moves with the price. When the price is above the Supertrend line, it indicates an uptrend and suggests a potential buy position. Conversely, when the price is below the Supertrend line, it hints at a downtrend, suggesting a potential selling point.
Strategy Goals and Objectives:
1. Trend Identification: At the core of the Supertrend Advance Strategy is the goal to efficiently and consistently identify prevailing market trends. By recognizing these trends, traders can position themselves to capitalize on price movements in their favor.
2. Reducing Noise: Financial markets are often inundated with 'noise' - short-term price fluctuations that can mislead traders. The Supertrend Advance Strategy aims to filter out this noise, allowing for clearer decision-making.
3. Enhancing Risk Management: With clear buy and sell signals, traders can set more precise stop-loss and take-profit points. This leads to better risk management and potentially improved profitability.
4. Versatility: While primarily used for trend identification, the strategy can be integrated with other technical tools and indicators to create a comprehensive trading system.
Type of Assets/Markets to Apply the Strategy:
1. Equities: The Supertrend Advance Strategy is highly popular among stock traders. Its ability to capture long-term trends makes it particularly useful for those trading individual stocks or equity indices.
2. Forex: Given the 24-hour nature of the Forex market and its propensity for trends, the Supertrend Advance Strategy is a valuable tool for currency traders.
3. Commodities: Whether it's gold, oil, or agricultural products, commodities often move in extended trends. The strategy can help in identifying and capitalizing on these movements.
4. Cryptocurrencies: The volatile nature of cryptocurrencies means they can have pronounced trends. The Supertrend Advance Strategy can aid crypto traders in navigating these often tumultuous waters.
5. Futures & Options: Traders and investors in derivative markets can utilize the strategy to make more informed decisions about contract entries and exits.
It's important to note that while the Supertrend Advance Strategy can be applied across various assets and markets, its effectiveness might vary based on market conditions, timeframe, and the specific characteristics of the asset in question. As always, it's recommended to use the strategy in conjunction with other analytical tools and to backtest its effectiveness in specific scenarios before committing to trades.
4. Input Settings
Understanding and correctly configuring input settings is crucial for optimizing the Supertrend Advance Strategy for any specific market or asset. These settings, when tweaked correctly, can drastically impact the strategy's performance.
Grouping Inputs:
Before diving into individual input settings, it's important to group similar inputs. Grouping can simplify the user interface, making it easier to adjust settings related to a specific function or indicator.
Strategy Choice:
This input allows traders to select from various strategies that incorporate the Supertrend indicator. Options might include "Supertrend with RSI," "Supertrend with MACD," etc. By choosing a strategy, the associated input settings for that strategy become available.
Supertrend Settings:
1. Multiplier: Typically, a default value of 3 is used. This multiplier is used in the ATR calculation. Increasing it makes the Supertrend line further from prices, while decreasing it brings the line closer.
2. Period: The number of bars used in the ATR calculation. A common default is 7.
EMA Settings (Exponential Moving Average):
1. Period: Defines the number of previous bars used to calculate the EMA. Common periods are 9, 21, 50, and 200.
2. Source: Allows traders to choose which price (Open, Close, High, Low) to use in the EMA calculation.
RSI Settings (Relative Strength Index):
1. Length: Determines how many periods are used for RSI calculation. The standard setting is 14.
2. Overbought Level: The threshold at which the asset is considered overbought, typically set at 70.
3. Oversold Level: The threshold at which the asset is considered oversold, often at 30.
MACD Settings (Moving Average Convergence Divergence):
1. Short Period: The shorter EMA, usually set to 12.
2. Long Period: The longer EMA, commonly set to 26.
3. Signal Period: Defines the EMA of the MACD line, typically set at 9.
CCI Settings (Commodity Channel Index):
1. Period: The number of bars used in the CCI calculation, often set to 20.
2. Overbought Level: Typically set at +100, denoting overbought conditions.
3. Oversold Level: Usually set at -100, indicating oversold conditions.
SL/TP Settings (Stop Loss/Take Profit):
1. SL Multiplier: Defines the multiplier for the average true range (ATR) to set the stop loss.
2. TP Multiplier: Defines the multiplier for the average true range (ATR) to set the take profit.
Filtering Conditions:
This section allows traders to set conditions to filter out certain signals. For example, one might only want to take buy signals when the RSI is below 30, ensuring they buy during oversold conditions.
Trade Direction and Backtest Period:
1. Trade Direction: Allows traders to specify whether they want to take long trades, short trades, or both.
2. Backtest Period: Specifies the time range for backtesting the strategy. Traders can choose from options like 'Last 6 months,' 'Last 1 year,' etc.
It's essential to remember that while default settings are provided for many of these tools, optimal settings can vary based on the market, timeframe, and trading style. Always backtest new settings on historical data to gauge their potential efficacy.
5. Understanding Strategy Conditions
Developing an understanding of the conditions set within a trading strategy is essential for traders to maximize its potential. Here, we delve deep into the logic behind these conditions, using the Supertrend Advance Strategy as our focal point.
Basic Logic Behind Conditions:
Every strategy is built around a set of conditions that provide buy or sell signals. The conditions are based on mathematical or statistical methods and are rooted in the study of historical price data. The fundamental idea is to recognize patterns or behaviors that have been profitable in the past and might be profitable in the future.
Buy and Sell Conditions:
1. Buy Conditions: Usually formulated around bullish signals or indicators suggesting upward price momentum.
2. Sell Conditions: Centered on bearish signals or indicators indicating downward price momentum.
Simple Strategy:
The simple strategy could involve using just the Supertrend indicator. Here:
• Buy: When price closes above the Supertrend line.
• Sell: When price closes below the Supertrend line.
Pullback Strategy:
This strategy capitalizes on price retracements:
• Buy: When the price retraces to the Supertrend line after a bullish signal and is supported by another bullish indicator.
• Sell: When the price retraces to the Supertrend line after a bearish signal and is confirmed by another bearish indicator.
Indicators Used:
EMA (Exponential Moving Average):
• Logic: EMA gives more weight to recent prices, making it more responsive to current price movements. A shorter-period EMA crossing above a longer-period EMA can be a bullish sign, while the opposite is bearish.
RSI (Relative Strength Index):
• Logic: RSI measures the magnitude of recent price changes to analyze overbought or oversold conditions. Values above 70 are typically considered overbought, and values below 30 are considered oversold.
MACD (Moving Average Convergence Divergence):
• Logic: MACD assesses the relationship between two EMAs of a security’s price. The MACD line crossing above the signal line can be a bullish signal, while crossing below can be bearish.
CCI (Commodity Channel Index):
• Logic: CCI compares a security's average price change with its average price variation. A CCI value above +100 may mean the price is overbought, while below -100 might signify an oversold condition.
And others...
As the strategy expands or contracts, more indicators might be added or removed. The crucial point is to understand the core logic behind each, ensuring they align with the strategy's objectives.
Logic Behind Each Indicator:
1. EMA: Emphasizes recent price movements; provides dynamic support and resistance levels.
2. RSI: Indicates overbought and oversold conditions based on recent price changes.
3. MACD: Showcases momentum and direction of a trend by comparing two EMAs.
4. CCI: Measures the difference between a security's price change and its average price change.
Understanding strategy conditions is not just about knowing when to buy or sell but also about comprehending the underlying market dynamics that those conditions represent. As you familiarize yourself with each condition and indicator, you'll be better prepared to adapt and evolve with the ever-changing financial markets.
6. Trade Execution and Management
Trade execution and management are crucial aspects of any trading strategy. Efficient execution can significantly impact profitability, while effective management can preserve capital during adverse market conditions. In this section, we'll explore the nuances of position entry, exit strategies, and various Stop Loss (SL) and Take Profit (TP) methodologies within the Supertrend Advance Strategy.
Position Entry:
Effective trade entry revolves around:
1. Timing: Enter at a point where the risk-reward ratio is favorable. This often corresponds to confirmatory signals from multiple indicators.
2. Volume Analysis: Ensure there's adequate volume to support the movement. Volume can validate the strength of a signal.
3. Confirmation: Use multiple indicators or chart patterns to confirm the entry point. For instance, a buy signal from the Supertrend indicator can be confirmed with a bullish MACD crossover.
Position Exit Strategies:
A successful exit strategy will lock in profits and minimize losses. Here are some strategies:
1. Fixed Time Exit: Exiting after a predetermined period.
2. Percentage-based Profit Target: Exiting after a certain percentage gain.
3. Indicator-based Exit: Exiting when an indicator gives an opposing signal.
Percentage-based SL/TP:
• Stop Loss (SL): Set a fixed percentage below the entry price to limit potential losses.
• Example: A 2% SL on an entry at $100 would trigger a sell at $98.
• Take Profit (TP): Set a fixed percentage above the entry price to lock in gains.
• Example: A 5% TP on an entry at $100 would trigger a sell at $105.
Supertrend-based SL/TP:
• Stop Loss (SL): Position the SL at the Supertrend line. If the price breaches this line, it could indicate a trend reversal.
• Take Profit (TP): One could set the TP at a point where the Supertrend line flattens or turns, indicating a possible slowdown in momentum.
Swing high/low-based SL/TP:
• Stop Loss (SL): For a long position, set the SL just below the recent swing low. For a short position, set it just above the recent swing high.
• Take Profit (TP): For a long position, set the TP near a recent swing high or resistance. For a short position, near a swing low or support.
And other methods...
1. Trailing Stop Loss: This dynamic SL adjusts with the price movement, locking in profits as the trade moves in your favor.
2. Multiple Take Profits: Divide the position into segments and set multiple TP levels, securing profits in stages.
3. Opposite Signal Exit: Exit when another reliable indicator gives an opposite signal.
Trade execution and management are as much an art as they are a science. They require a blend of analytical skill, discipline, and intuition. Regularly reviewing and refining your strategies, especially in light of changing market conditions, is crucial to maintaining consistent trading performance.
7. Visual Representations
Visual tools are essential for traders, as they simplify complex data into an easily interpretable format. Properly analyzing and understanding the plots on a chart can provide actionable insights and a more intuitive grasp of market conditions. In this section, we’ll delve into various visual representations used in the Supertrend Advance Strategy and their significance.
Understanding Plots on the Chart:
Charts are the primary visual aids for traders. The arrangement of data points, lines, and colors on them tell a story about the market's past, present, and potential future moves.
1. Data Points: These represent individual price actions over a specific timeframe. For instance, a daily chart will have data points showing the opening, closing, high, and low prices for each day.
2. Colors: Used to indicate the nature of price movement. Commonly, green is used for bullish (upward) moves and red for bearish (downward) moves.
Trend Lines:
Trend lines are straight lines drawn on a chart that connect a series of price points. Their significance:
1. Uptrend Line: Drawn along the lows, representing support. A break below might indicate a trend reversal.
2. Downtrend Line: Drawn along the highs, indicating resistance. A break above might suggest the start of a bullish trend.
Filled Areas:
These represent a range between two values on a chart, usually shaded or colored. For instance:
1. Bollinger Bands: The area between the upper and lower band is filled, giving a visual representation of volatility.
2. Volume Profile: Can show a filled area representing the amount of trading activity at different price levels.
Stop Loss and Take Profit Lines:
These are horizontal lines representing pre-determined exit points for trades.
1. Stop Loss Line: Indicates the level at which a trade will be automatically closed to limit losses. Positioned according to the trader's risk tolerance.
2. Take Profit Line: Denotes the target level to lock in profits. Set according to potential resistance (for long trades) or support (for short trades) or other technical factors.
Trailing Stop Lines:
A trailing stop is a dynamic form of stop loss that moves with the price. On a chart:
1. For Long Trades: Starts below the entry price and moves up with the price but remains static if the price falls, ensuring profits are locked in.
2. For Short Trades: Starts above the entry price and moves down with the price but remains static if the price rises.
Visual representations offer traders a clear, organized view of market dynamics. Familiarity with these tools ensures that traders can quickly and accurately interpret chart data, leading to more informed decision-making. Always ensure that the visual aids used resonate with your trading style and strategy for the best results.
8. Backtesting
Backtesting is a fundamental process in strategy development, enabling traders to evaluate the efficacy of their strategy using historical data. It provides a snapshot of how the strategy would have performed in past market conditions, offering insights into its potential strengths and vulnerabilities. In this section, we'll explore the intricacies of setting up and analyzing backtest results and the caveats one must be aware of.
Setting Up Backtest Period:
1. Duration: Determine the timeframe for the backtest. It should be long enough to capture various market conditions (bullish, bearish, sideways). For instance, if you're testing a daily strategy, consider a period of several years.
2. Data Quality: Ensure the data source is reliable, offering high-resolution and clean data. This is vital to get accurate backtest results.
3. Segmentation: Instead of a continuous period, sometimes it's helpful to backtest over distinct market phases, like a particular bear or bull market, to see how the strategy holds up in different environments.
Analyzing Backtest Results:
1. Performance Metrics: Examine metrics like the total return, annualized return, maximum drawdown, Sharpe ratio, and others to gauge the strategy's efficiency.
2. Win Rate: It's the ratio of winning trades to total trades. A high win rate doesn't always signify a good strategy; it should be evaluated in conjunction with other metrics.
3. Risk/Reward: Understand the average profit versus the average loss per trade. A strategy might have a low win rate but still be profitable if the average gain far exceeds the average loss.
4. Drawdown Analysis: Review the periods of losses the strategy could incur and how long it takes, on average, to recover.
9. Tips and Best Practices
Successful trading requires more than just knowing how a strategy works. It necessitates an understanding of when to apply it, how to adjust it to varying market conditions, and the wisdom to recognize and avoid common pitfalls. This section offers insightful tips and best practices to enhance the application of the Supertrend Advance Strategy.
When to Use the Strategy:
1. Market Conditions: Ideally, employ the Supertrend Advance Strategy during trending market conditions. This strategy thrives when there are clear upward or downward trends. It might be less effective during consolidative or sideways markets.
2. News Events: Be cautious around significant news events, as they can cause extreme volatility. It might be wise to avoid trading immediately before and after high-impact news.
3. Liquidity: Ensure you are trading in assets/markets with sufficient liquidity. High liquidity ensures that the price movements are more reflective of genuine market sentiment and not due to thin volume.
Adjusting Settings for Different Markets/Timeframes:
1. Markets: Each market (stocks, forex, commodities) has its own characteristics. It's essential to adjust the strategy's parameters to align with the market's volatility and liquidity.
2. Timeframes: Shorter timeframes (like 1-minute or 5-minute charts) tend to have more noise. You might need to adjust the settings to filter out false signals. Conversely, for longer timeframes (like daily or weekly charts), you might need to be more responsive to genuine trend changes.
3. Customization: Regularly review and tweak the strategy's settings. Periodic adjustments can ensure the strategy remains optimized for the current market conditions.
10. Frequently Asked Questions (FAQs)
Given the complexities and nuances of the Supertrend Advance Strategy, it's only natural for traders, both new and seasoned, to have questions. This section addresses some of the most commonly asked questions regarding the strategy.
1. What exactly is the Supertrend Advance Strategy?
The Supertrend Advance Strategy is an evolved version of the traditional Supertrend indicator. It's designed to provide clearer buy and sell signals by incorporating additional indicators like EMA, RSI, MACD, CCI, etc. The strategy aims to capitalize on market trends while minimizing false signals.
2. Can I use the Supertrend Advance Strategy for all asset types?
Yes, the strategy can be applied to various asset types like stocks, forex, commodities, and cryptocurrencies. However, it's crucial to adjust the settings accordingly to suit the specific characteristics and volatility of each asset type.
3. Is this strategy suitable for day trading?
Absolutely! The Supertrend Advance Strategy can be adjusted to suit various timeframes, making it versatile for both day trading and long-term trading. Remember to fine-tune the settings to align with the timeframe you're trading on.
4. How do I deal with false signals?
No strategy is immune to false signals. However, by combining the Supertrend with other indicators and adhering to strict risk management protocols, you can minimize the impact of false signals. Always use stop-loss orders and consider filtering trades with additional confirmation signals.
5. Do I need any prior trading experience to use this strategy?
While the Supertrend Advance Strategy is designed to be user-friendly, having a foundational understanding of trading and market analysis can greatly enhance your ability to employ the strategy effectively. If you're a beginner, consider pairing the strategy with further education and practice on demo accounts.
6. How often should I review and adjust the strategy settings?
There's no one-size-fits-all answer. Some traders adjust settings weekly, while others might do it monthly. The key is to remain responsive to changing market conditions. Regular backtesting can give insights into potential required adjustments.
7. Can the Supertrend Advance Strategy be automated?
Yes, many traders use algorithmic trading platforms to automate their strategies, including the Supertrend Advance Strategy. However, always monitor automated systems regularly to ensure they're operating as intended.
8. Are there any markets or conditions where the strategy shouldn't be used?
The strategy might generate more false signals in markets that are consolidative or range-bound. During significant news events or times of unexpected high volatility, it's advisable to tread with caution or stay out of the market.
9. How important is backtesting with this strategy?
Backtesting is crucial as it allows traders to understand how the strategy would have performed in the past, offering insights into potential profitability and areas of improvement. Always backtest any new setting or tweak before applying it to live trades.
10. What if the strategy isn't working for me?
No strategy guarantees consistent profits. If it's not working for you, consider reviewing your settings, seeking expert advice, or complementing the Supertrend Advance Strategy with other analysis methods. Remember, continuous learning and adaptation are the keys to trading success.
Other comments
Value of combining several indicators in this script and how they work together
Diversification of Signals: Just as diversifying an investment portfolio can reduce risk, using multiple indicators can offer varied perspectives on potential price movements. Each indicator can capture a different facet of the market, ensuring that traders are not overly reliant on a single data point.
Confirmation & Reduced False Signals: A common challenge with many indicators is the potential for false signals. By requiring confirmation from multiple indicators before acting, the chances of acting on a false signal can be significantly reduced.
Flexibility Across Market Conditions: Different indicators might perform better under different market conditions. For example, while moving averages might excel in trending markets, oscillators like RSI might be more useful during sideways or range-bound conditions. A mashup strategy can potentially adapt better to varying market scenarios.
Comprehensive Analysis: With multiple indicators, traders can gauge trend strength, momentum, volatility, and potential market reversals all at once, providing a holistic view of the market.
How do the different indicators in the Supertrend Advance Strategy work together?
Supertrend: This is primarily a trend-following indicator. It provides traders with buy and sell signals based on the volatility of the price. When combined with other indicators, it can filter out noise and give more weight to strong, confirmed trends.
EMA (Exponential Moving Average): EMA gives more weight to recent price data. It can be used to identify the direction and strength of a trend. When the price is above the EMA, it's generally considered bullish, and vice versa.
RSI (Relative Strength Index): An oscillator that measures the magnitude of recent price changes to evaluate overbought or oversold conditions. By cross-referencing with other indicators like EMA or MACD, traders can spot potential reversals or confirmations of a trend.
MACD (Moving Average Convergence Divergence): This indicator identifies changes in the strength, direction, momentum, and duration of a trend in a stock's price. When the MACD line crosses above the signal line, it can be a bullish sign, and when it crosses below, it can be bearish. Pairing MACD with Supertrend can provide dual confirmation of a trend.
CCI (Commodity Channel Index): Initially developed for commodities, CCI can indicate overbought or oversold conditions. It can be used in conjunction with other indicators to determine entry and exit points.
In essence, the synergy of these indicators provides a balanced, comprehensive approach to trading. Each indicator offers its unique lens into market conditions, and when they align, it can be a powerful indication of a trading opportunity. This combination not only reduces the potential drawbacks of each individual indicator but leverages their strengths, aiming for more consistent and informed trading decisions.
Backtesting and Default Settings
• This indicator has been optimized to be applied for 1 hour-charts. However, the underlying principles of this strategy are supply and demand in the financial markets and the strategy can be applied to all timeframes. Daytraders can use the 1min- or 5min charts, swing-traders can use the daily charts.
• This strategy has been designed to identify the most promising, highest probability entries and trades for each stock or other financial security.
• The combination of the qualifiers results in a highly selective strategy which only considers the most promising swing-trading entries. As a result, you will normally only find a low number of trades for each stock or other financial security per year in case you apply this strategy for the daily charts. Shorter timeframes will result in a higher number of trades / year.
• Consequently, traders need to apply this strategy for a full watchlist rather than just one financial security.
• Default properties: RSI on (length 14, RSI buy level 50, sell level 50), EMA, RSI, MACD on, type of strategy pullback, SL/TP type: ATR (length 10, factor 3), trade direction both, quantity 5, take profit swing hl 5.1, highest / lowest lookback 2, enable ATR trail (ATR length 10, SL ATR multiplier 1.4, TP multiplier 2.1, lookback = 4, trade direction = both).

Exponential ADR with Price TargetsThis script is designed to help you analyze price movements in the financial markets by calculating the Average Daily Range (ADR), adjusting it based on exponentiality and generating price targets based on that range.
The ADR represents the average range between the highest and lowest prices of a trading instrument during a specific period. It gives you an idea of how much the price typically moves in a day. In this script, we calculate the ADR using Simple Moving Averages (SMA) of the high and low prices over a certain length of time. You can customize this length according to your preference.
To make the ADR smoother and more responsive to recent price changes, we apply an Exponential Moving Average (EMA) to the ADR values. The EMA places more weight on recent data, giving you a more up-to-date measure of the ADR. The length of the EMA is also adjustable.
Once we have the Exponential ADR, we can generate price targets based on it. Price targets are potential levels where the price may reach in the future. We calculate these targets by adding or subtracting a certain multiple of the Exponential ADR from the current closing price. The multiple is determined by a parameter called the "Target Multiplier." You can adjust this value to control the distance of the price targets from the closing price.
In addition to plotting the Exponential ADR as a histogram on the chart, we create a table that displays the price targets. The table shows three bullish (positive) targets and three bearish (negative) targets. The targets are labeled as "Bull Target" or "Bear Target" followed by a number indicating the target's order. For each target, we display the corresponding price level.
To estimate the potential price levels, we used a formula that takes into account the current closing price and a value called the Exponential Average Daily Range (Exponential ADR). The Exponential ADR represents the average range of price movement over a specific period.
To calculate the price targets, we multiplied the Exponential ADR by a user-defined value called the target multiplier. This target multiplier allows traders to control the distance of the price targets from the current price. The resulting value indicates the desired distance from the current price for each target level.
For bullish targets, we added the calculated value to the current closing price. This suggests potential upward movement in the price. On the other hand, for bearish targets, we subtracted the calculated value from the current closing price. This indicates potential downward movement in the price.
By providing multiple target levels, such as level 1, level 2, and level 3, traders can assess different scenarios and potential price outcomes. These target levels help traders identify possible price levels where they might consider taking profit or adjusting their trading positions.
It's important to note that these price targets are not guaranteed to be reached, but they serve as reference points based on historical price behavior and the Exponential ADR. Traders can use them as part of their overall trading strategy and decision-making process.
Adjust the input parameters according to your desired settings, such as the ADR length, EMA length, target multiplier, table position, and table style. The indicator will then calculate and display the Exponential ADR and price targets on the chart, helping you identify potential levels of support and resistance for your trading decisions.
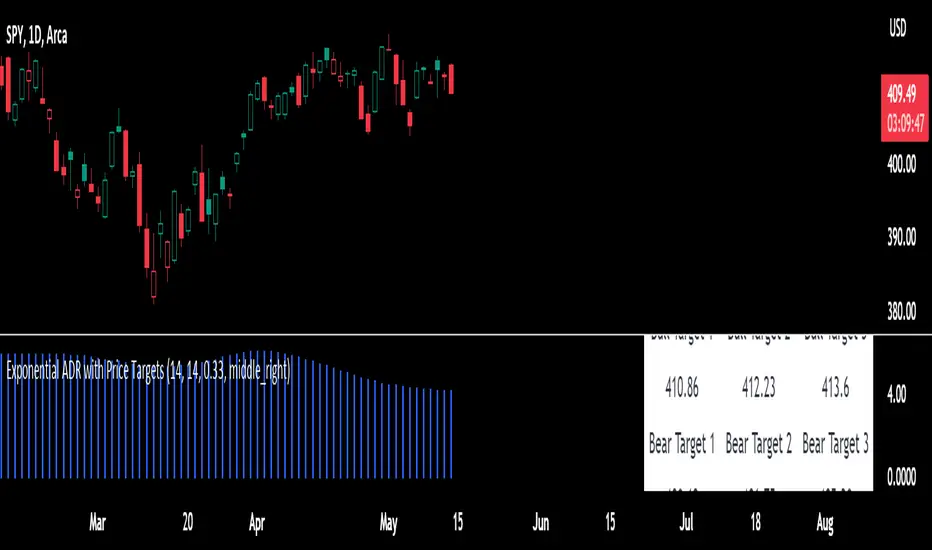
[blackcat] L1 True Range Adjusted EMA (TRAdj EMA) Level: 1
Background
In Traders’ Tips in January 2023, Vitali Apirine published an article in the January 2023 issue, “True Range Adjusted Exponential Moving Average (TRAdj EMA)”.
I use pine v4 to script it.
Function
Vitali Apirine's article True Range Adjusted Exponential Moving Average (TRAdj EMA) presents how a security's True Range, which measures volatility, can be integrated into a traditional exponential moving average. The trend following indicator called True Range Adjusted Exponential Moving Average (TRAdj EMA) applied with different lengths can help define turning points and filter price movements. By comparing the indicator to an exponential moving average of the same length, the trader can gain insight into the overall trend.
Remarks
Feedbacks are appreciated.
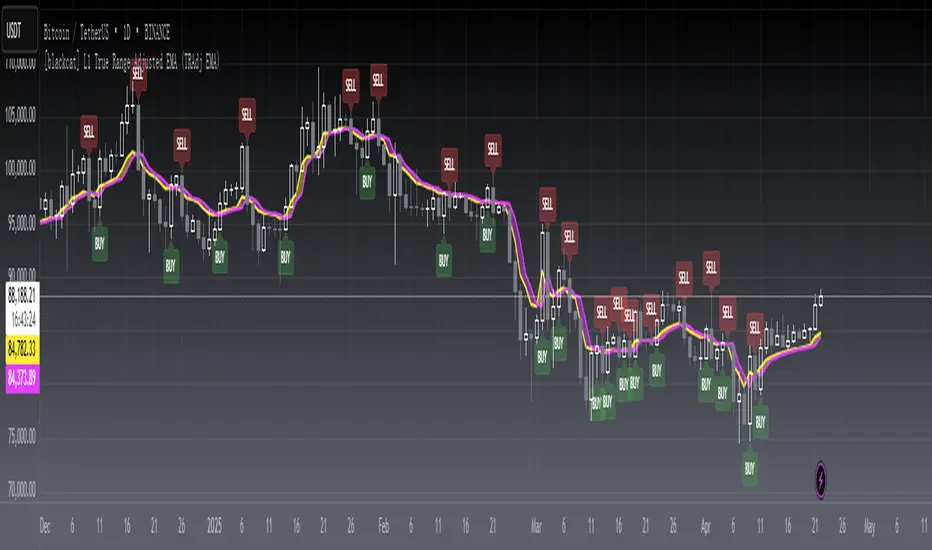
Fast EMA above Slow EMA with MACD (by Coinrule)An exponential moving average ( EMA ) is a type of moving average (MA) that places a greater weight and significance on the most recent data points. The exponential moving average is also referred to as the exponentially weighted moving average . An exponentially weighted moving average reacts more significantly to recent price changes than a simple moving average simple moving average ( SMA ), which applies an equal weight to all observations in the period.
Moving average convergence divergence ( MACD ) is a trend-following momentum indicator that shows the relationship between two moving averages of a security’s price. The MACD is calculated by subtracting the 26-period exponential moving average ( EMA ) from the 12-period EMA .
The result of that calculation is the MACD line. A nine-day EMA of the MACD called the "signal line," is then plotted on top of the MACD line, which can function as a trigger for buy and sell signals. Traders may buy the coin when the MACD crosses above its signal line and sell—or short—the security when the MACD crosses below the signal line. Moving average convergence divergence ( MACD ) indicators can be interpreted in several ways, but the more common methods are crossovers, divergences, and rapid rises/falls.
The Strategy enters and closes the trade when the following conditions are met:
LONG
The MACD histogram turns bullish
EMA8 is greater than EMA26
EXIT
Price increases 3% trailing
Price decreases 1% trailing
This strategy is back-tested from 1 January 2022 to simulate how the strategy would work in a bear market and provides good returns.
Pairs that produce very strong results include AXSUSDT on the 5-minute timeframe. This short timeframe means that this strategy opens and closes trades regularly.
Additionally, the trailing stop loss and take profit conditions can also be changed to match your needs.
The strategy assumes each order is using 30% of the available coins to make the results more realistic and to simulate you only ran this strategy on 30% of your holdings. A trading fee of 0.1% is also taken into account and is aligned to the base fee applied on Binance.

Catching the Bottom (by Coinrule)This script utilises the RSI and EMA indicators to enter and close the trade.
The relative strength index (RSI) is a momentum indicator used in technical analysis. RSI measures the speed and magnitude of a security's recent price changes to evaluate overvalued or undervalued conditions in the price of that security. The RSI is displayed as an oscillator (a line graph) on a scale of zero to 100. The RSI can do more than point to overbought and oversold securities. It can also indicate securities that may be primed for a trend reversal or corrective pullback in price. It can signal when to buy and sell. Traditionally, an RSI reading of 70 or above indicates an overbought situation. A reading of 30 or below indicates an oversold condition.
An exponential moving average (EMA) is a type of moving average (MA) that places a greater weight and significance on the most recent data points. The exponential moving average is also referred to as the exponentially weighted moving average. An exponentially weighted moving average reacts more significantly to recent price changes than a simple moving average simple moving average (SMA), which applies an equal weight to all observations in the period.
The strategy enters and exits the trade based on the following conditions.
ENTRY
RSI has a decrease of 3.
RSI <40.
EMA100 has crossed above the EMA50.
EXIT
RSI is greater than 65.
EMA9 has crossed above EMA50.
This strategy is back tested from 1 April 2022 to simulate how the strategy would work in a bear market and provides good returns.
Pairs that produce very strong results include ETH on the 5m timeframe, BNB on 5m timeframe, XRP on the 45m timeframe, MATIC on the 30m timeframe and MATIC on the 2H timeframe.
The strategy assumes each order is using 30% of the available coins to make the results more realistic and to simulate you only ran this strategy on 30% of your holdings. A trading fee of 0.1% is also taken into account and is aligned to the base fee applied on Binance.

SUPER MACD📈 MACD Indicator Update - Version 2
🔹 New Features and Improvements:
1️⃣ New MACD Calculation Options:
Users can now choose from various Moving Averages to calculate the MACD. The default options are SMA (Simple Moving Average) and EMA (Exponential Moving Average), but there are 14 other versions available to experiment with:
SMA (Simple Moving Average)
EMA (Exponential Moving Average)
WMA (Weighted Moving Average)
RMA (Smoothed Moving Average)
HMA (Hull Moving Average)
JMA (Jurik Moving Average)
DEMA (Double Exponential Moving Average)
TEMA (Triple Exponential Moving Average)
LSMA (Least Squares Moving Average)
VWMA (Volume-Weighted Moving Average)
SMMA (Smoothed Moving Average)
KAMA (Kaufman’s Adaptive Moving Average)
ALMA (Arnaud Legoux Moving Average)
FRAMA (Fractal Adaptive Moving Average)
VIDYA (Variable Index Dynamic Average)
2️⃣ Improved Input Visibility and Organization:
We’ve reorganized the inputs so that the most commonly used ones are now placed at the beginning for quicker and more convenient configuration.
3️⃣ Bug Fixes and Code Improvements:
Minor bugs have been fixed, and the code has been optimized for better stability and performance. The code is now cleaner and fully functional in version 6.
4️⃣ Cometreon Public Library Integration:
To lighten the code and improve its modularity, we’ve integrated the Cometreon public library. This makes the code more efficient and reduces the need to duplicate common functions.
☄️ With this update, the MACD indicator becomes even more versatile and user-friendly, offering a wide range of calculation methods and an improved interface!

EMA curvesPlot EMAs for lengths 9, 21, 55 ,100, 200
An exponential moving average (EMA) is a type of moving average (MA) that places a greater weight and significance on the most recent data points. The exponential moving average is also referred to as the exponentially weighted moving average. An exponentially weighted moving average reacts more significantly to recent price changes than a simple moving average simple moving average (SMA), which applies an equal weight to all observations in the period.
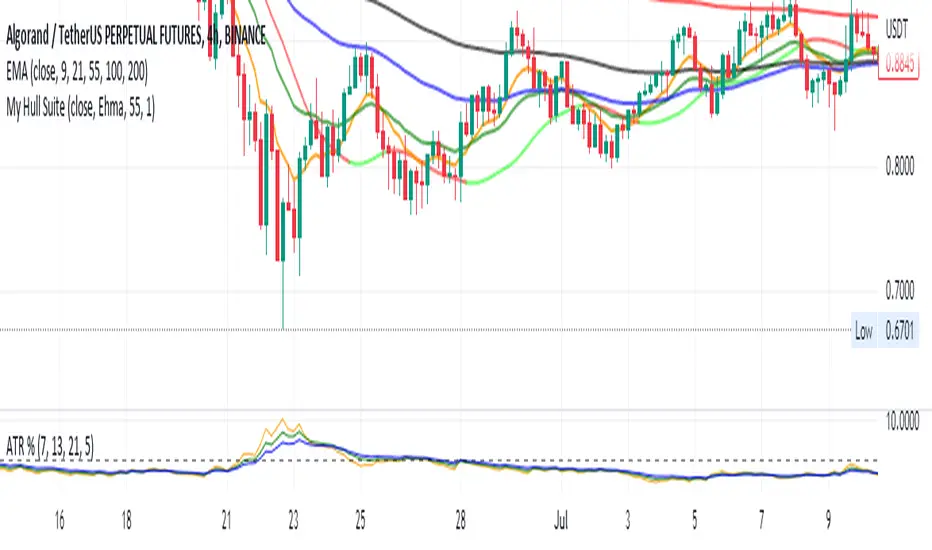
KAIRI RELATIVE INDEXAn old but gold Japanese indicator for Mean Reverting strategies and ideal for Pairs Trading...
The Kairi Relative Index measures the distance between closing prices and a Moving Average in percent value (generally SMA).
Extreme reading in the KRI are considered buy and sell signals.
Extreme readings will vary by asset, with more volatile assets reaching much higher and lower extremes that more sedate assets.
The KRI is not an accurate timing signal, and therefore, should be combined with other forms of analysis to generate trade signals.
You can calculate percent difference between the price and 10 different types of Moving Averages in this version of KAIRI as:
SMA : Simple Moving Average
EMA : Exponential Moving Average
WMA : Weighted Moving Average
TMA : Triangular Moving Average
VAR : Variable Index Dynamic Moving Average a.k.a. VIDYA
WWMA : Welles Wilder's Moving Average
ZLEMA : Zero Lag Exponential Moving Average
TSF : True Strength Force
HULL : Hull Moving Average
VWMA: Volume Veighted Moving Average
Personal advice: try using bigger length of Moving Averages like 50-100-200 for pairs and mean reversion strategies